Photogrammetric angular measurements as a diagnostic tool for orthodontic treatment planning


*Corresponding author: Laishram Bijaya Devi, Associate Professor, Department of Orthodontics and Dentofacial Orthopedics, Regional Institute of Medical Sciences, Imphal, Manipur, India. lbijaya@hotmail.com
-
Received: ,
Accepted: ,
How to cite this article: Devi LB, Keisam A. Photogrammetric angular measurements as a diagnostic tool for orthodontic treatment planning. J Global Oral Health 2023;6:79-84.
Abstract
Objectives:
The aim of the study was to compare and correlate angular measurements of soft-tissue profile between cephalogram and photograph and to identify gender difference.
Materials and Methods:
Sample size consisted of 100 lateral cephalograms and 100 profile photographs of 100 Indian Bengali population aged 18– 25 years (50 males and 50 females; mean age = 21.28 years). All records were taken in natural head position, centric occlusion, and lips in relaxed position. For evaluation of method reliability, intra-class correlation coefficients (ICCs) were calculated from repeated photographic measurements. Similarly, cephalometric and photographic measurements were compared for assessing Pearson correlation coefficients. Linear regression analyses were done for the variable with correlation coefficients >r = 0.7. Ten angular parameters were used for soft tissue analysis and t-test was used for comparison. Statistical analyses were done using the Statistical Package for the Social Sciences for Windows software version 21.0.
Results:
The reliability test for photographs was found satisfactory with most measurements showing ICCs ≥ 0.90 and highly significant correlations (P ≤ 0.001) with cephalometric measurements. The N’-Prn’-Pg’ angle was found most effective for female subjects (r2 = 0.82), the N’-Prn’/N’-Pg’ angle for male subjects (r2 = 0.89) and among total subjects, the N’-Prn’/N’-Pg’ angle (r2 = 0.88).
Conclusion:
Photographs may be used for soft tissue evaluation for diagnosis and treatment planning as an alternative to cephalometric soft-tissue analysis.
Keywords
Cephalogram
Normal occlusion
Photograph
Soft-tissue profile

INTRODUCTION
Orthodontic treatment is now becoming a trend in developing countries. Maximum orthodontic patients want to improve facial aspects along with improvement of their structural and functional problems.[1] As a part of orthodontic treatment, diagnosis and treatment planning procedures become a very sensitive area to improve facial esthetics. Hence, digital lateral cephalograms and photographs allow a quick and more accurate information for treatment.[2] According to many studies, soft-tissue measurements are equally important as hard-tissue measurements for a successful treatment planning.[3,4] Linear and angular soft-tissue facial analysis based on photogrammetry has been extensively used for orthodontic treatment planning.[5] Two-dimensional photogrammetry is said to be quick, basic, non-invasive and cost-effective method which provides a permanent record of the face and it can also be accessed later.[6]
Compared to photographs which have only soft-tissue analysis, lateral cephalograms have consistent relationships between facial overlying tissues and skeletal structures through analysis. Even though both are two dimensional, these are still extensively used today.[7,8] Dawns discussed comparative views on both lateral cephalograms and profile photographs that both are equally important for orthodontic diagnosis and treatment planning.[9] Evaluation of measurements of both hard-bony structures and soft tissue must be carried out to bring balance and harmony.[10,11] Two-dimensional photogrammetry analysis can reproduce reliable measurements for evaluation and it has been used extensively for diagnosis and treatment planning.[12,13]
In other studies on facial profile, diagnostic accuracy was the main concern and photographs being low-cost and noninvasive has been used as an alternative to cephalograms for assessment of patient’s soft-tissue profile.[14-18]
MATERIALS AND METHODS
The cross-sectional study comprised of 100 students (50 males and 50 females) aged between 18–25 years (mean = 21.28 years) studying in the Dr. R. Ahmed Dental College and Hospital, Kolkata, West Bengal. All students selected were of Indian Bengali population with good facial symmetry, determined clinically by two Orthodontists and one layman. They had Angle’s Class I occlusion with normal overjet-overbite relationship with minor or no crowding. Subjects with any history of previous orthodontic or surgical treatment, significant medical history, craniofacial trauma, and prosthesis were excluded from the study. Participants were explained the details of the study and an informed written consent was obtained.
Sample size calculation was done using the formula, n = [(Zα+Zβ)/C]2 + 3; with α = 0.05, β = 0.1 where α is the type I error, β is the type II error, Zα is the standard normal deviate for α, Zβ is the standard normal deviate for β, C = 0.5* ln[(1+r)/(1-r)] and r is the expected correlation coefficient and expected correlation coefficient as 0.39.[6] The sample size was calculated as 99 rounded off to 100.
A 100 mm Macro Lens was used to maintain the natural proportions and built-in flashlight was used for uniform or constant illumination. The camera to the subject distance was maintained at a constant distance of 5 feet marked on the floor. A vertical measurement scale in millimeters was placed behind the subject which allowed the photographs to recode at life size. The true vertical was obtained using a plumb line, suspending a 200 g weight hung from the scale held by a thick thread. A mirror was kept at 4 feet in front of the subject so that they can look at their eye level with the lips relaxed so that the right-side profile records were taken in natural head position (NHP). Tracing was done and soft tissue landmarks were marked and angular photogrammetric analysis was carried out.
Digital lateral cephalogram were taken with the Carestream CS8000C Digital system. The exposure parameters were kept standard at 82 kV, 10 mA, and 5.2 s and 1:1 scale (life size) was kept for zero magnification error. The cephalograms were taken in NHP (mirror position) with Centric Occlusion Position and relaxed-lip posture.
The landmarks used for the study are given in Figures 1a & b. Angular parameters used are given in Figures 2 and 3. The result was statistically analyzed using the Statistical Package for the Social Sciences for Windows software version 21.0. Descriptive statistics were done and independent sample t-test was done for evaluation of sexual dimorphism. Intraclass correlation coefficients (ICCs) were estimated from repeated photographic measurements for evaluation of the method’s repeatability and reproducibility. Cephalometric measurements were compared to the similar photographic measurements to assess Pearson correlation coefficients. Linear regression analyses were done between cephalometric (dependent variable) and photographic (independent variable) measurements for correlation coefficients more than r = 0.7 and P ≤ 0.001 were considered statistically significant.

- Soft tissue landmarks on (a) Photograph and (b) Lateral cephalogram: Glabella (G’; G), Nasion (N’; N), Nasal dorsum (Nd’: Nd), Pronasal (Prn’; Prn), Columella (Cm’; Cm), Subnasal (Sn’; Sn), Labial superior (Ls’; Ls), Labial inferior (Li’; Li), Supramental (Sm’; Sm), Pogonion (Pg’; Pg’).
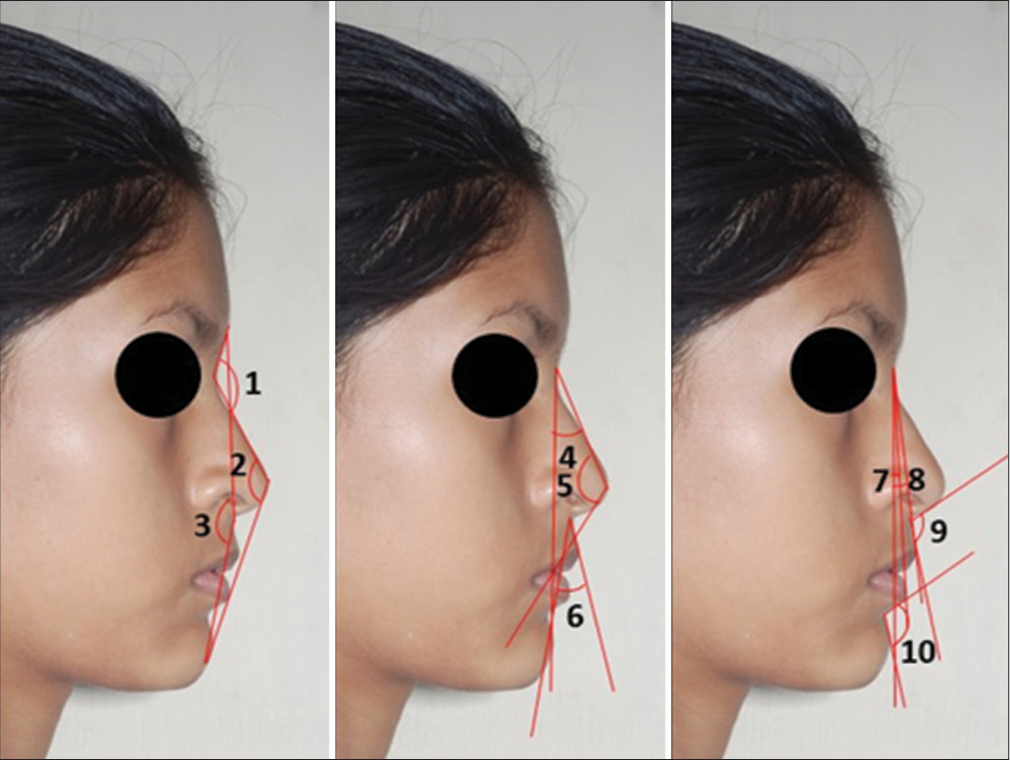
- Angular measurements on Photograph: (1) Nasofrontal angle, G’-N’-Nd’, (2) Total facial angle, N’-Prn’-Pg’, (3) Facial angle, G’-Sn’-Pg’, (4) Nasomental angle, N’-Prn’/N’-Pg’, (5) Nose tip angle, N’-Prn’-Cm’, (6) Upper lip angle, Sn’-Ls’/Sn’-Pg’, (7) Projection of lower lip to chin, N’-Pg’/N’-Li’, (8) Projection of upper lip to chin, N’-Pg’/N’-Ls’, (9) Nasolabial angle, Cm’-Sn’-Ls’, (10) Mentolabial angle, Li’-Sm’-
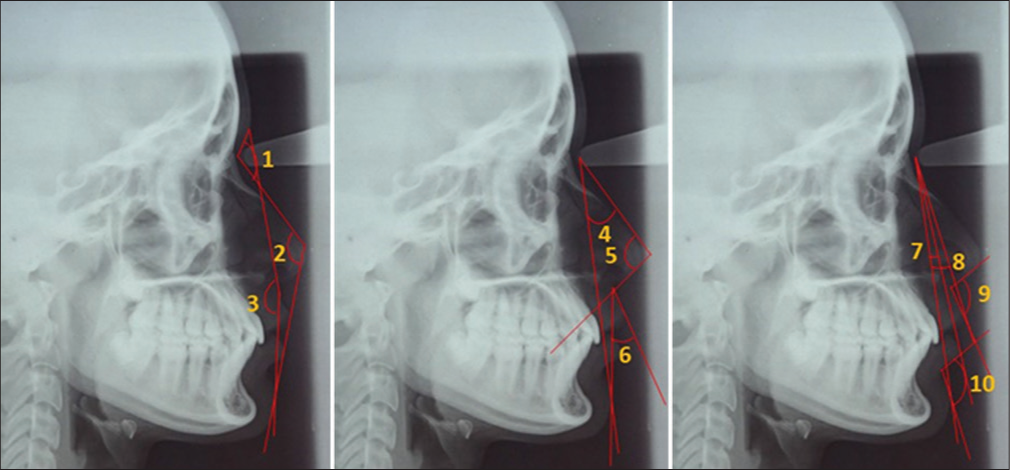
- Angular measurements on Cephalogram: (1) Nasofrontal angle, G-N-Nd, (2) Total facial angle, N-Prn-Pg, (3) Facial angle, G-Sn-Pg, (4) Nasomental angle, N-Prn/N-Pg, (5) Nose tip angle, N-Prn-Cm, (6) Upper lip angle, Sn-Ls/Sn-Pg, (7) Projection of lower lip to chin, N-Pg/N-Li, (8) Projection of upper lip to chin, N-Pg/N-Ls, (9) Nasolabial angle, Cm-Sn-Ls, (10) Mentolabial angle, Li-Sm-Pg.
RESULTS
The photographic setup showed high repeatability and reproducibility with ICCs ≥ 0.90 for all the parameters. Descriptive statistics including mean, standard deviation, ranges, and t-test for gender differences are given in Tables 1 and 2. Among photographic measurements, the angles (G’-Sn’-Pg’, N’-Prn’-Pg’, G’-N’-Nd’, Cm’-Sn’-Ls’, N’-Prn’/N’-Pg’, and Sn’-Ls’/Sn’-Pg’) showed gender difference (P ≤ 0.01). Among cephalometric measurements, the angles (G-N-Nd, Cm-Sn-Ls, N-Prn-Cm, N-Prn-Cm, N-Prn/N-Pg, and Sn-Ls/Sn-Pg) showed gender difference (P ≤ 0.01).
| Angular parameters | All subjects (n=100) | Male subjects (n=50) | Female subjects (n=50) | Gender difference | ||||||||||
|---|---|---|---|---|---|---|---|---|---|---|---|---|---|---|
| Mean | SD | Min | Max | Mean | SD | Min | Max | Mean | SD | Min | Max | Mean | Significance | |
| G’-Sn’-Pg’ | 166.64 | 4.02 | 158.7 | 177.8 | 165.13 | 3.30 | 161.8 | 177.8 | 168.15 | 4.14 | 158.7 | 176.6 | −3.02 | * |
| N’-Prn’-Pg’ | 129.52 | 3.23 | 122.5 | 138.0 | 128.50 | 2.99 | 123.4 | 135.5 | 130.55 | 3.16 | 122.5 | 138.0 | −2.05 | * |
| G’-N’-Nd’ | 133.81 | 8.39 | 114.5 | 154.7 | 128.06 | 6.98 | 114.5 | 145.6 | 139.56 | 5.11 | 127.2 | 154.7 | −11.50 | * |
| Cm’-Sn’-Ls’ | 104.13 | 12.35 | 79.0 | 132.4 | 107.39 | 12.62 | 88.5 | 132.4 | 100.88 | 11.28 | 79.0 | 117.3 | 6.51 | * |
| Li’-Sm’-Pg’ | 123.95 | 11.99 | 99.7 | 150.5 | 124.85 | 14.67 | 100.8 | 150.5 | 123.04 | 8.58 | 99.7 | 139.4 | 1.81 | NS |
| N’-Pg’/N’-Ls’ | 8.35 | 1.93 | 2.8 | 11.1 | 8.61 | 1.89 | 4.2 | 11.1 | 8.09 | 1.95 | 2.8 | 10.3 | 0.52 | NS |
| N’-Pg’/N’-Li’ | 3.88 | 1.88 | −1.1 | 8.2 | 3.82 | 1.86 | 0.6 | 7.0 | 3.93 | 1.91 | −1.1 | 8.2 | −0.11 | NS |
| N’-Prn’-Cm’ | 114.14 | 4.15 | 102.7 | 120.0 | 113.53 | 4.48 | 102.7 | 120.0 | 114.76 | 3.73 | 107.0 | 119.8 | −1.23 | NS |
| N’-Prn’/N’-Pg’ | 31.06 | 3.67 | 23.5 | 45.8 | 32.60 | 4.25 | 23.5 | 45.8 | 29.53 | 2.09 | 24.3 | 34.2 | 3.07 | * |
| Sn’-Ls’/Sn’-Pg’ | 14.68 | 7.01 | 1.4 | 29.2 | 12.84 | 5.72 | 1.4 | 23.7 | 16.52 | 7.73 | 2.5 | 29.2 | −3.68 | * |
Min: Minimum; Max: Maximum, SD: Standard deviation, NS: Not significant. *P≤0.0, n: Number of subjects
| Angular parameters | All subjects (n=100) | Male subjects (n=50) | Female Subjects (n=50) | Gender difference | ||||||||||
|---|---|---|---|---|---|---|---|---|---|---|---|---|---|---|
| Mean | SD | Min | Max | Mean | SD | Min | Max | Mean | SD | Min | Max | Mean | Significance | |
| G-Sn-Pg | 163.51 | 4.25 | 152.7 | 177.8 | 163.08 | 4.35 | 153.0 | 177.8 | 163.95 | 4.16 | 152.7 | 175.0 | −0.87 | NS |
| N-Prn-Pg | 128.30 | 3.52 | 120.5 | 138.0 | 127.50 | 3.28 | 121.0 | 135.5 | 129.10 | 3.60 | 120.5 | 138.0 | −1.60 | NS |
| G-N-Nd | 126.68 | 5.15 | 115.0 | 135.0 | 123.71 | 4.29 | 115.0 | 130.6 | 129.64 | 4.16 | 120.0 | 135.0 | −5.90 | * |
| Cm-Sn-Ls | 106.06 | 8.34 | 90.0 | 132.3 | 110.23 | 8.94 | 97.7 | 132.3 | 101.88 | 5.02 | 90.0 | 114.0 | 8.35 | * |
| Li-Sm-Pg | 122.79 | 6.98 | 105.3 | 146.5 | 121.58 | 7.72 | 105.3 | 146.5 | 124.00 | 5.98 | 116.8 | 139.0 | −2.42 | NS |
| N-Pg/N-Ls | 10.28 | 2.03 | 4.8 | 18.0 | 10.36 | 2.20 | 5.6 | 18.0 | 10.20 | 1.87 | 4.8 | 13.0 | 0.16 | NS |
| N-Pg/N-Li | 2.89 | 1.58 | −0.5 | 6.4 | 2.77 | 1.74 | 0.3 | 6.4 | 3.02 | 1.40 | −0.5 | 6.0 | −0.25 | NS |
| N-Prn-Cm | 118.57 | 5.57 | 102.7 | 128.8 | 116.48 | 5.80 | 102.7 | 128.8 | 120.66 | 4.48 | 109.0 | 128.0 | −4.18 | * |
| N-Prn/N-Pg | 32.16 | 3.74 | 23.5 | 46.8 | 33.51 | 4.49 | 23.5 | 46.8 | 30.81 | 2.10 | 27.0 | 35.0 | 2.70 | * |
| Sn-Ls/Sn-Pg | 20.75 | 5.62 | 11.0 | 33.0 | 17.94 | 4.71 | 11.7 | 29.9 | 23.57 | 5.04 | 11.0 | 33.0 | −5.63 | * |
Min: Minimum, Max: Maximum, SD: Standard deviation, NS: Not significant. *P≤0.01, n: Number of subjects
Highly significant correlations were observed for most parameters with P ≤ 0.001 [Table 3]. Pearson correlation coefficients were kept from weak to strong range (0.12 ≤ r ≤ 0.94). For total sample, the coefficients between N’-Prn’/N’-Pg’ vs N-Prn/N-Pg (r = 0.94) and N’-Pg’/N’-Li’ vs N-Pg/N-Li (r = 0.86) showed strong correlation and weak correlation for Cm’-Sn’-Ls’ vs Cm-Sn-Ls (r = 0.42) and Sn’-Ls’/Sn’-Pg’ Sn-Ls/Sn-Pg (r = 0.32).
| Angular parameters | All subjects (n=100) | Male subjects (n=50) | Female Subjects (n=50) | ||||
|---|---|---|---|---|---|---|---|
| Photographic | Cephalometric | Correlation (r) | Significance | Correlation (r) | Significance | Correlation (r) | Significance |
| G’-Sn’-Pg’# | G-Sn-Pg | 0.62 | *** | 0.39 | ** | 0.85 | *** |
| N’-Prn’-Pg’# | N-Prn-Pg | 0.83 | *** | 0.73 | *** | 0.91 | *** |
| G’-N’-Nd’# | G-N-Nd# | 0.65 | *** | 0.64 | *** | 0.18 | * |
| Cm’-Sn’-Ls’# | Cm-Sn-Ls# | 0.42 | *** | 0.54 | *** | 0.12 | * |
| Li’-Sm’-Pg’ | Li-Sm-Pg | 0.73 | *** | 0.71 | *** | 0.89 | *** |
| N’-Pg’/N’-Ls’ | N-Pg/N-Ls | 0.73 | *** | 0.54 | *** | 0.95 | *** |
| N’-Pg’/N’-Li’ | N-Pg/N-Li | 0.86 | *** | 0.88 | *** | 0.86 | *** |
| N’-Prn’-Cm’ | N-Prn-Cm# | 0.63 | *** | 0.57 | *** | 0.72 | *** |
| N’-Prn’/N’-Pg’# | N-Prn/N-Pg# | 0.94 | *** | 0.94 | *** | 0.88 | *** |
| Sn’-Ls’/Sn’-Pg’# | Sn-Ls/Sn-Pg# | 0.32 | *** | 0.16 | * | 0.28 | * |
#Variables with sexual dimorphism. *P≤0.05, **P≤0.01, ***P≤0.001, n: Number of subjects
The results of linear regression are given in Table 4, Figures 4a and b. Among the total sample, the photographic variable, the N’-Prn’/N’-Pg’ angle showed the best result with r2 = 0.88. Among female subjects, the N’-Prn’-Pg’ angle showed the highest coefficient of determination (r2 = 0.82) and among male subjects, the N’-Prn’/N’-Pg’ angle was found even higher coefficient of determination (r2 = 0.89).
| Photographic variable (x) | Cephalometric variable (y) | Type of sample | Intercept coefficient (a) | Slope coefficient (b) | Significance | Std. error of the estimates | Coefficient of determination (r2) |
|---|---|---|---|---|---|---|---|
| N’-Prn’-Pg’ | N-Prn-Pg | T | 10.351 | 0.91 | *** | 1.95 | 0.69 |
| M | 24.82 | 0.79 | *** | 2.28 | 0.52 | ||
| F | −6.42 | 1.03 | *** | 1.51 | 0.82 | ||
| Li’-Sm’-Pg’ | Li-Sm-Pg | T | 70.06 | 0.42 | *** | 4.79 | 0.54 |
| N’-Pg’/N’-Ls’ | N-Pg/N-Ls | T | 3.88 | 0.77 | *** | 1.40 | 0.53 |
| N’-Pg’/N’-Li’ | N-Pg/N-Li | T | 0.07 | 0.73 | *** | 0.80 | 0.75 |
| N’-Prn’/N’-Pg’ | N-Prn/N-Pg | T | 2.37 | 0.96 | *** | 1.28 | 0.88 |
| M | 1.00 | 0.99 | *** | 1.49 | 0.89 | ||
| F | 4.65 | 0.88 | *** | 1.01 | 0.78 |
T indicates total sample (n=100), M: Male (n=50), F: Female (n=50). Values for the M and F groups shown are only for the photographic variables with sexual dimorphism. ***P≤0.001
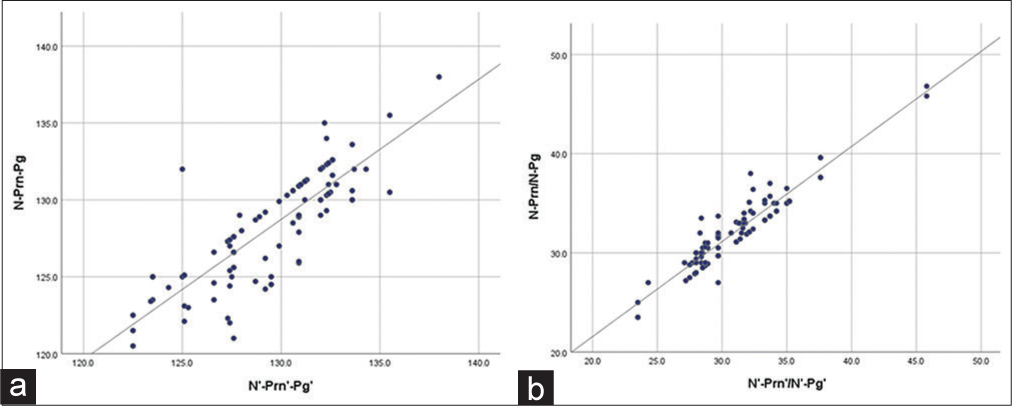
- Scatterplots showing linear regression results between cephalometric and photographic measurements (n = 100) (a) N-Prn-Pg versus N’-Prn’-Pg’ (b) N-Prn/N-Pg versus N’-Prn’/N’-Pg’.
DISCUSSION
As the literature developed on how to improve profile of orthodontic patients , several studies on comparison between cephalometric and photographic measurements have been increasing day by day as photographic technique is cost-effective and non-invasive.[1-5] There are many other studies that expressed their findings on feasibility of applying photographic measurements as an alternative to cephalometric measurements.[6-10]
In the present study, six variables (facial, total facial, nasofrontal, nasolabial, nasomental, and upper lip angles) showed gender difference (P ≤ 0.01) among all the photographic variables. Pandian et al.,[13] also found the nasofrontal angle, nasolabial angle, and mentolabial angle statistically significant gender difference among 18–25 year old Indian population (P ≤ 0.05). Milosevic et al.,[16] also found distinct gender difference in nasofrontal, nasolabial, mentolabial, and nasal tip angles among 23–25 year old Croatian population (P ≤ 0.01). Malkoç et al.,[17] also presented gender difference with mentolabial and cervicomental angles (P ≤ 0.05) in the 19–25 year old Turkish population. Fernández-Riveiro et al.,[19] also performed a study among 18–20 year old European Caucasian population and found distinct gender differences with nasofrontal, vertical nasal, nasal, nasal dorsum, and mandibular contour angles (P ≤ 0.01).
In the present study, there were no statistically significant gender difference in mentolabial, projection of upper lip to chin, projection of lower lip to chin, and nose tip angles for the photographic measurements. Milosevic et al.,[16] also found no gender difference in facial, total facial, projection of upper lip to chin, projection of lower lip to chin, upper lip, and Nasomental angles. Malkoç et al.,[17] also observed no statistical gender difference in nasofrontal, nasal, vertical nasal, and nasal dorsum angles.
The parameters (nasofrontal, nasolabial, nose tip, nasomental, and upper lip angles) among cephalometric parameters showed gender difference (P ≤ 0.01), whereas the total facial, facial, projection of upper lip to chin, projection of lower lip to chin and mentolabial angles found no gender difference. However, only one angle (Frankfort to occlusal plane angle) showed gender difference in a study by Gomes et al.,[7] and no statistically significant gender difference in a study by Dayal et al.,[15] among 18–35-year-old Indo-Aryan Indian races.
In the present study, coefficients were highly significant (P ≤ 0.001) and ranged from weak to strong (0.12 ≤ r ≤ 0.94) supporting the previous studies such as Negi et al.,[6] reported weak to strong correlation (0.11≤ r ≤ 0.76), Gomes et al.,[7] correlation (0.39≤ r ≤ 0.89), Castillo et al.,[11] (0.04 ≤ r ≤ 0.88), Zhang et al.,[20] (0.36 ≤ r ≤ 0.64), and Bittner and Pancherz[21] reported moderate to strong correlations (0.63≤ r ≤ 0.93).
In the present study, the linear regression analysis for the total sample showed the best results for Nasomental angle (r2 = 0.88) and total facial angle (r2 = 69). In the previous studies, de Carvalho Rosas Gomes et al.,[7] found best results for maxillomandibular angular discrepancy (r2 = 0.68) and Frankfort to mandibular plane angle (r2 = 0.65).
The present study was performed because of low-cost and non-invasive photographic technique as compared to cephalometric method so that photographs can be used as an alternative to cephalograms in subjects with normal occlusion and pleasing profile of 18–25 years old where very minimal amount of hard and soft tissue growth changes occurred.[6,13,16-19] A standardized protocol must include positioning of accurate landmark by palpation of the anatomic points with stickers for reproducibility test.[7] Method error calculation is also needed if the study is to be performed on a large population.[10,13,16-19]
CONCLUSION
The facial, total facial, nasofrontal, nasolabial, nasomental, and upper lip angles showed significant gender difference among photographic variables and nasofrontal, nasolabial, nose tip, nasomental, and upper lip angles among cephalometric parameters (P ≤ 0.01). The correlations found were highly significant. The photographic set-up was found to be cost effective, repeatable, reproducible, and non-invasive. Hence, soft-tissue profile photographic analysis follows a standardized protocol and can be used as an alternative to cephalometric analysis of soft-tissue structure.
Declaration of patient consent
The authors certify that they have obtained all appropriate patient consent.
Conflicts of interest
There are no conflicts of interest.
Financial support and sponsorship
Nil.
References
- Assessing soft-tissue characteristics of facial asymmetry with photographs. Am J Orthod Dentofacial Orthop. 2010;138:23-31.
- [CrossRef] [PubMed] [Google Scholar]
- Soft tissue analysis and cast measurement in orthodontics using digital photogrammetry. Int Arch Photogrammetry Remote Sens. 2000;33:699-706.
- [Google Scholar]
- Comparison of soft tissue cephalometric norms between Turkish and European-American adults. ScientificWorldJournal. 2013;2013:806203.
- [CrossRef] [PubMed] [Google Scholar]
- A novel method of photogrammetry measurements of study models in orthodontics. Srp Arh Celok Lek. 2018;147:74.
- [CrossRef] [Google Scholar]
- Analysis of the soft tissue profile in Croatians with normal occlusions and well-balanced faces. Eur J Orthod. 2011;33:305-10.
- [CrossRef] [PubMed] [Google Scholar]
- Photogrammetric correlation of face with frontal radiographs and direct measurements. J Clin Diagn Res. 2017;11:C79-83.
- [CrossRef] [PubMed] [Google Scholar]
- Photographic assessment of cephalometric measurements. Angle Orthod. 2013;83:1049-68.
- [CrossRef] [PubMed] [Google Scholar]
- Photogrammetry as a tool to aid orthodontic diagnosis and treatment assessment. J Contemp Orthod. 2017;1:50-5.
- [Google Scholar]
- Photographic facial soft tissue analysis by means of linear and angular measurements in an adolescent persian population. Open Dent J. 2015;9:346-56.
- [CrossRef] [PubMed] [Google Scholar]
- The relationship between 3D dentofacial photogrammetry measurements and traditional cephalometric measurements. Angle Orthod. 2019;89:275-83.
- [CrossRef] [PubMed] [Google Scholar]
- Reliability of reference distances used in photogrammetry. Angle Orthod. 2010;80:482-9.
- [CrossRef] [PubMed] [Google Scholar]
- Angular photogrammetric analysis of the soft-tissue facial profile of Indian adults. Indian J Dent Res. 2018;29:137-43.
- [CrossRef] [PubMed] [Google Scholar]
- A three-dimensional photogrammetric analysis of the facial esthetics of the Miss Korea pageant contestants. Korean J Orthod. 2017;47:87-99.
- [CrossRef] [PubMed] [Google Scholar]
- Comparison of angular and linear measurements of soft tissue profile between cephalograms and photograph in subjects with Class I and Class II malocclusion. J Dent Oral Sci. 2017;2:1-10.
- [Google Scholar]
- Analysis of the soft tissue facial profile by means of angular measurements. Eur J Orthod. 2008;30:135-40.
- [CrossRef] [PubMed] [Google Scholar]
- Angular photogrammetric analysis of the soft tissue facial profile of Turkish adults. Eur J Orthod. 2009;31:174-9.
- [CrossRef] [PubMed] [Google Scholar]
- Linear photogrammetric analysis of the soft tissue facial profile. Am J Orthod Dentofacial Orthop. 2002;122:59-66.
- [CrossRef] [PubMed] [Google Scholar]
- Angular photogrammetric analysis of the soft tissue facial profile. Eur J Orthod. 2003;25:393-9.
- [CrossRef] [PubMed] [Google Scholar]
- Correlations between cephalometric and facial photographic measurements of craniofacial form. Am J Orthod Dentofacial Orthop. 2007;131:67-71.
- [CrossRef] [PubMed] [Google Scholar]
- Facial morphology and malocclusions. Am J Orthod Dentofacial Orthop. 1990;97:308-15.
- [CrossRef] [PubMed] [Google Scholar]