Translate this page into:
Unemployment and vulnerable financial situation among recent dental graduates of Kerala, India - Results from a cross-sectional study
* Corresponding author: Malu Mohan, Sree Chitra Tirunal Institute for Medical Science and Technology, Achutha Menon Centre for Health Science Studies, Near Government Medical College, Thiruvananthapuram – 695 011, Kerala, India. dr.malumohan@gmail.com
-
Received: ,
Accepted: ,
Does not include the teaching faculty employed in the five government dental colleges
Abstract
Objective:
This study aims to examine the current employment characteristics and financial situation of recent dental graduates of Kerala, India, in the context of a drastic rise in the number of dental graduates in the state over the past two decades, following a policy change in dental education at the dawn of the 21st century.
Methodology:
A cross-sectional study was conducted among 400 recent dental graduates selected using circular systematic random sampling from a sampling frame of all dental graduates who graduated in any dental college in Kerala between April 2014 and February 2018 and who have registered at the Kerala State Dental Council.
Results:
More than two-thirds of the participants were females. Graduates trained from private dental colleges formed the majority. A significant proportion was currently unemployed (27%). The private sector was the predominant employment avenue for the dental graduates (90.9%). A notable proportion of the study participants did not have a regular income (32.1%). The current employment status of the graduates showed a statistically significant difference in proportions according to gender, type of educational institution, and the employment status of the graduates’ male parents. There were significant differences in the current financial situation according to gender, caste, and training background.
Conclusion:
The study reveals the existence of a high rate of unemployment among the recent dental graduates of Kerala. Their financial situation is indicative of vulnerability and dependent status. These findings have major policy implications for dental training and regulation of dental profession in the country.
Keywords
Dental education
Dental profession
Dental graduates
Unemployment
Financial situation


INTRODUCTION
Dental education in India has witnessed a drastic growth since the 1990s and there was a sharp rise in the number of private for-profit institutions and dental graduates over the past three decades.[1] A similar pattern of sweeping growth has been reported in dental education from other countries such as Brazil, Columbia, Chile, Mexico, and Iran.[2-6] Some of the consequences of such growth have been rising unemployment, low incomes, financial stress and debt among graduates and a fall in the academic ranking of dentistry.[2-5] These consequences indicate that, the drastic growth of dental education in these settings, have also adversely impacted the professional circumstances of dentists.
The results of a cross-sectional survey conducted among FDI member nations published in 2012 report that many developing countries stated an oversupply of dentists. Migration of dentists to high-income countries in search of employment was another trend reported from many developing countries. Despite such reports which indicate a dearth of employment opportunities for dentists, many of these countries also reported the presence of underserved communities and areas in terms of oral health-care access, clearly indicating a situation of improper workforce planning.[7]
Kerala, the southernmost state of India, underwent a policy change at the dawn of the 21st century which allowed the entry of private for-profit institutions into the health professional training sector. Subsequently, dental education underwent a phase of extensive growth in terms of the number of training institutions dominated by the private for-profit sector. Currently, there are 25 dental colleges in the state, of which 20 are in the private sector.[8] Similar to the rest of the country, the predominant employment avenue for the dental graduates in the state is the private dental practice sector. This, along with the nature of growth witnessed in education, makes the case of dental profession in the state an archetype of the profession in the country.
The data from the Kerala State Dental Council indicate that, as of November 2018, there are 21,050 registered dental graduates in the state. The proportion of dental graduates employed (permanently or on contract basis) in the state public health sector is <1%,a making private dental practice sector, practically the sole employment avenue for dentists. Naturally, the prospects of dental professionals working in the state depend on the professional circumstances - employment opportunities and financial benefits - available to them in the private practice sector. Considering the rising number of new graduates every year, it is important to understand the current professional and financial circumstances of young dentists. Hence, we conducted this study to examine the current employment characteristics and financial situation of recent dental graduates of Kerala.
METHODOLOGY
This cross-sectional study was part of a larger research study conducted between July 2017 and June 2018, which examined the context and processes of policy change in dental education in Kerala and its implications for the dental profession. The survey was conducted among a sample of 400 recent dental graduates randomly selected from a sampling frame of all dentists who completed BDS degree from any public or private dental college within Kerala recognized by the Dental Council of India between 2014 April and 2018 February (i.e., passed the final year BDS examination and completed an internship during this time period) and registered with the State Dental Council within the time period. The graduates also had to have their permanent address (according to the information provided by the graduate at the State Dental Council during registration) in one of the six districts of South and Central Kerala (Thiruvananthapuram, Kollam, Alappuzha, Pathanamthitta, Kottayam, and Ernakulam) purposively selected for the study.
The sample size was estimated based on a previous study conducted in Australia which assessed the preparedness for general practice among dental students following graduation, with an absolute precision of 5% and expecting a non-response rate of 20%; the sample size was estimated to be 440.[9,10] However, after completion of the survey among 133 participants (about one-third of the initial sample size), the non-response rate was found to be lower (9.02%) and the sample size was reestimated using the lower non-response rate to reach at a sample size of 399 (which was rounded off to 400).
From among the registered graduates in the sampling frame, the graduates who studied BDS outside Kerala were excluded in the first step. Subsequently, separate district-wise sampling frame of graduates who have their permanent residences in one of the six chosen districts was prepared. The sample to be selected from each district was finalized maintaining the proportion of the district-wise list to the original sampling frame. The sample selected from each district-wise list also maintained the public-trained to private-trained ratio of the district-wise sampling frame.
The final participants for the survey were identified through circular systematic random sampling. That is, the total number of graduates in each district was divided by the number of graduates required in each category (public or private) to identify the sampling interval in each category. The graduates were contacted by email and/or telephone, and only those who verbally consented to a one-to-one meeting were approached directly at their current residences, workplaces, or any other convenient place of their choice for the survey. To facilitate field work, the graduates were grouped by location, home addresses, and/or workplace addresses whichever was deemed comfortable by the graduates on initial contact. Subsequently, we met the graduates from the identified addresses personally to collect data using a self-administered questionnaire. The questionnaire had three main parts - socio-demographic details of the graduates including details of their parents’ education and occupation, the sources used by the family to finance the graduate training of the participants and training, current employment characteristics and monthly income of the graduates.
The four major outcome variables of the survey were sociodemographic characteristics, training characteristics, employment characteristics, and current financial situation of the graduates. We also explored the association between the sociodemographic profile/training characteristics and employment characteristics and current financial situation of the graduates, by testing the statistical significance of difference in proportions using Chi-square tests.
The study received ethics clearance from the Institutional Ethics Committee, Sree Chitra Tirunal Institute for Medical Sciences and Technology, Trivandrum. Written informed consent was sought from every study participant before their participation in the study. The data were entered into a Microsoft Excel spreadsheet and analyzed using Statistical Program for the Social Sciences version 21.
RESULTS
In the initial part of this segment, we present the sociodemographic profile, training and employment characteristics, and the income earned by the study participants.
Sociodemographic Profile
Table 1 depicts the sociodemographic profile and training characteristics of the study participants. More than two-thirds of the participants were females, which are consistent with the gender distribution in the sampling frame. The representation of graduates belonging to the Scheduled Castes in the sample was slightly lower when compared to their representation in the total population of the state.
| Variables | Proportion of participants (%) |
|---|---|
| Gender | |
| Women | 276 (69) |
| Men | 124 (31) |
| Caste | |
| OBC (non-creamy layer)# | 138 (34.5) |
| General | 132 (32.75) |
| OBC (creamy layer)## | 97 (24.25) |
| SC | 33 (8.5) |
| Source of financing for graduate education | |
| Financed by parents or family | 187 (46.8) |
| Sale of assets alone | 160 (40) |
| Educational loan alone | 32 (8.0) |
| Both of the above | 21 (5.2) |
| Education: Type of institution | |
| Private | 307 (76.8) |
| Public | 76 (19) |
| Cooperative | 17 (4.3) |
| Type of seat$ | |
| Merit seat | 169 (42.25) |
| Management/NRI seats | 231 (57.75) |
| Currently employed* in dentistry (n=269; 67.3%) | |
| Pursuing a full-time job as a dental practitioner | 167 (62.1) |
| Pursuing a part-time job as a dental practitioner© | 99 (36.8) |
| Resident (pursuing Post Graduation) in dentistry with a stipend | 3 (1.1) |
| Pursuing a job in dentistry without an income (n=19; 4.7%) | |
| Resident (pursuing postgraduation) in dentistry without a stipend | 12 (63.2) |
| Senior resident in district hospitals/observer at private clinics | 7 (36.8) |
| Currently not employed in dentistry (n=112; 28.0%) | |
| Currently not pursuing any job | 108 (96.4) |
| Pursuing a full-time job in a different stream | 4 (3.6) |
| Profile of the “currently not pursuing any job” (n=108; 27%) | |
| Seeking any employment | 20 (18.5) |
| Seeking better employment opportunities | 18 (16.7) |
| Preparing for higher education | 12 (11.1) |
| Homemaker | 9 (8.3) |
| Homemaker preparing for higher education | 24 (22.2) |
| Seeking better employment opportunities and preparing for higher education | 16 (14.8) |
| Preparing for career paths abroad | 9 (8.3) |
| Sectors of employment among the graduates working in dentistry@ (n=288; 72%) | |
| Private (clinics/colleges) | 262 (90.9) |
| Public (district/taluk hospitals) | 26 (9.02) |
| Ownership of clinics among the graduates@ (n=288; 72) | |
| Complete | 35 (12.2) |
| Partial | 7 (2.4) |
| Do not own a clinic | 246 (85.4) |
OBC (non-creamy layer)
The socioeconomic situation of the graduates was assessed through their parents’ educational background, parents’ occupation (at the time when the graduates enrolled for the course), whether the household had both members employed, and sources through which their graduate training was financed. A majority of the parents had completed graduation (43.5% of the fathers and 48.75% of the mothers). >70% of the male parents of dental graduates were non-professionalsb, and roughly equal proportions among them managed a business in India or held a permanent salaried job within the country. Professionals settled within or outside the country constituted only a small proportion of the male parents. Among the mothers, a majority were homemakers, and hence, most of the households had only one earning member. The graduate education of the majority of the graduates was financed through the sale of assets, educational loans, or both.
Training Characteristics
Graduates trained from private dental colleges formed the majority, those from government colleges were about one-fifth, and a small proportion was from colleges in the cooperative sector. A majority of the graduates in our study sample secured admissions through the category of seats reserved for the discretion of college managements or for the children of Non-Resident Indians [Table 1].
Employment Characteristics
While the majority of the graduates were currently engaged in various career options within dentistry, a significant proportion was currently unemployed. A small proportion had changed stream from dentistry. Among those who pursued dentistry, the majority were earning an income either as full time or as part-time practitioners or as residents. A small proportion was engaged in dentistry in public or private dental facilities, without an income. They worked as residents pursuing postgraduate training without a stipend or as graduate residents without a salary [Table 1].
Among those who were currently not employed, the majority reported that they were seeking employment. While most of the unemployed were seeking better employment opportunities than what was being offered to them at the time, a small proportion was unemployed despite being willing to accept any job in dentistry. There was also a category of unemployed, who were homemakers (all of whom were females).
The private sector was the predominant employment avenue for the dental graduates (90.9% of the graduates worked in the private sector). Only a small proportion of the employed graduates owned dental clinic/clinics, and the others worked in establishments owned by others.
Income Earned by the Graduates
A notable proportion of the study participants did not have a regular income [Figure 1]. In addition to the unemployed graduates, this group also included those who were working as residents in public/private dental care facilities without salary and those doing postgraduation in private dental colleges without stipend. Among those who were earning, the majority earned ≤15,000 INR. A large proportion of the graduates were yet to repay fully the educational loans taken to support graduate training [Figure 2].
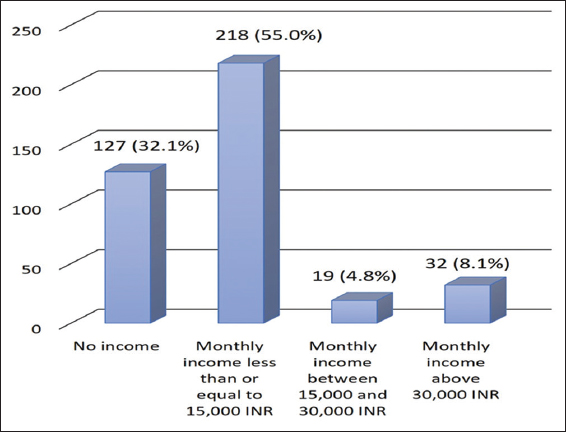
- Monthly income among the study participants.
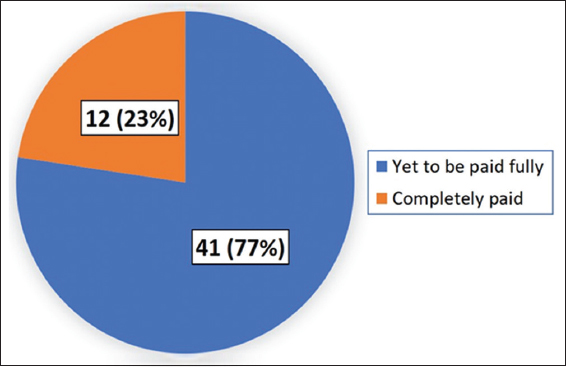
- Status of repayment of educational loans among the study participants.
In the following segment, we present the results of our exploration of the association between sociodemographic variables and training characteristics with the current employment and financial situation of the graduates. We also present the results of our exploration of the association between clinic ownership and the monthly income earned with the repayment of educational loans.
Association between Sociodemographic Variables/Training Background and the Employment Characteristics of the Graduates
The current employment status of the graduates showed a statistically significant difference in proportions according to gender and the employment status of the graduates’ male parents [Table 2]. The proportion of the “currently unemployed in dentistry” was found to be higher among the women compared to the men. The proportion of “currently unemployed in dentistry” was found to be significantly lower among the children of male parents who were professionals employed in India/abroad and non-professionals permanently employed abroad as compared to others. The proportion of the unemployed was found to be lower among the graduates who trained in government dental colleges as compared to those trained in private colleges or the cooperative sector dental college. The proportion of unemployed seemed to increase among the more recent graduates than earlier ones, even within the short period under consideration.
| Variables | Subgroups | Currently employed* (n=288) (%) | Currently not employed (n=112)** (%) | Chi-square | P-value |
|---|---|---|---|---|---|
| Gender | Women | 186 (67.4) | 90 (32.6) | 9.380 | 0.002 |
| Men | 102 (82.3) | 22 (17.7) | |||
| Caste | SC | 18 (54.5) | 15 (45.5) | 4.969 | 0.174 |
| OBC (non-creamy layer) | 101 (73.2) | 37 (26.8) | |||
| OBC (creamy layer) | 63 (64.9) | 34 (35.1) | |||
| General | 87 (65.9) | 45 (34.1) | |||
| Father’ s employment status (when the graduates joined for BDS) | Entrepreneurs or those engaged in temporary jobs (n=156) | 108 (69.2) | 48 (30.8) | 10.637 | 0.005 |
| Non-professional permanently employed in India (n=142) | 94 (66.2) | 48 (33.8) | |||
| Professionals permanently employed anywhere (n=102) | 86 (84.3) | 16 (15.7) | |||
| Mother’ s employment status (when the graduates joined for BDS) | Homemaker (n=298) | 217 (72.8) | 81 (27.2) | 2.427 | 0.297 |
| Entrepreneurs or those engaged in temporary jobs (n=21) | 12 (57.1) | 9 (42.9) | |||
| Non-professional/professional with a permanent employment in India (n=81) | 59 (72.8) | 22 (27.2) | |||
| Type of institution | Public | 73 (96.1) | 3 (3.9) | 27.431 | 0.000 |
| Private | 205 (66.8) | 102 (33.2) | |||
| Cooperative | 10 (58.8) | 7 (41.2) | |||
| Year of graduation | 2014–2015 (n=219) | 170 (77.6) | 49 (22.4) | 7.927 | 0.019 |
| 2015–2016 (n=153) | 101 (66.0) | 52 (34.0) | |||
| 2016–2018 (n=28) | 17 (60.7) | 11 (39.3) |
A greater proportion of men than women owned clinics. The proportion of graduates belonging to SC and Other Backward Class (OBC) non-creamy layer who owned clinics was lower than the proportion of graduates who belonged to the other two caste categories. We found that the parents’ employment characteristics were significantly associated with the graduates’ ownership of clinics. A greater proportion of clinic owners were offsprings of entrepreneurs.
Association between Sociodemographic Variables and Training Background on the Monthly Income of the Graduates
We found significant differences in the current financial situation according to gender, caste, and training background [Table 3]. The proportion of women earning >15,000 INR/month was significantly lower than the proportion of men earning that income. The proportion of women who did not earn anything was also found to be higher than men. Although there was no significant difference in employment status among the graduates who belonged to the four different caste categories, such a difference was observed in the case of monthly income. A majority of the graduates belonging to the OBC non-creamy layer category was employed in jobs which paid them ≤15,000 INR/month.
| Variables | Subgroups | Earn more than 15,000 INR/month (n=55) (%) | Earn less than or equal to 15,000 INR/month (n=218) (%) | Do not earn anything (n=127) (%) | Chi-square | P-value |
|---|---|---|---|---|---|---|
| Gender | Women | 31 (11.3) | 148 (53.6) | 97 (35.1) | 7.463 | 0.024 |
| Men | 24 (19.4) | 70 (56.5) | 30 (24.2) | |||
| Caste | SC | 5 (15.2) | 14 (42.4) | 14 (42.4) | 18.040 | 0.006 |
| OBC (non-creamy layer) | 11 (8.0) | 94 (68.1) | 33 (23.9) | |||
| OBC (creamy layer) | 15 (15.5) | 45 (46.4) | 37 (38.1) | |||
| General | 24 (18.2) | 65 (49.2) | 43 (32.6) | |||
| Father’s employment status (when the graduates joined for BDS) | Entrepreneurs or those engaged in temporary jobs | 24 (15.4) | 79 (50.6) | 53 (34.0) | 11.673 | 0.020 |
| Non-professional permanently employed in India | 20 (14.1) | 69 (48.6) | 53 (37.3) | |||
| Professionals permanently employed anywhere | 11 (10.8) | 70 (68.6) | 21 (20.6) | |||
| Mother’s employment status (when the graduates joined for BDS) | Homemaker | 42 (14.1) | 152 (51.0) | 104 (34.9) | 31.419 | 0.000 |
| Entrepreneurs or those engaged in temporary jobs | 10 (47.6) | 2 (9.5) | 9 (42.8) | |||
| Non-professional/professional with a permanent employment in India | 3 (3.7) | 52 (64.2) | 26 (32.1) | |||
| Type of institution | Public | 17 (22.4) | 49 (64.4) | 10 (13.2) | 18.071 | 0.001 |
| Private | 36 (11.7) | 162 (52.8) | 109 (35.5) | |||
| Cooperative | 2 (11.7) | 7 (41.2) | 8 (47.1) |
OBC: Other Backward Communities
The proportion of students who earned an income and also those who earned >15,000 INR was higher among the students who trained in government dental colleges as compared to those who trained in private colleges or in the cooperative dental college.
Association between Parents’ Socioeconomic Status, Clinic Ownership, and Monthly Income with the Repayment of Educational Loans
No significant difference was found between the proportion of clinic owners and others with regard to the payment of loans [Table 4]. Similarly, there was no significant difference in the proportion of graduates who earn >15,000 INR, who earn ≤15,000 INR, and those who do not earn anything on the status of payment of loans. We found that the parents’ employment characteristics had a significant association with full repayment of loans. The graduates whose parents were either professionals or permanently employed non-professionals had a greater chance of full repayment. Consequently, a greater proportion of fully repaid loans was among the graduates who belonged to those households which had both the father and the mother as earning members as compared to the households where the father alone earned.
| Variables | Subgroups | Loans paid (n=12) (%) | Loans yet to be repaid fully (n=41) (%) | Chi-square | P-value |
|---|---|---|---|---|---|
| Gender | Women (n=33) | 8 (24.2) | 25 (75.8) | 0.128 | 0.499 |
| Men (n=20) | 4 (20.0) | 16 (80.0) | |||
| Caste | SC and OBC (non-creamy layer) (n=25) | 4 (16.0) | 21 (84.0) | 1.192 | 0.224 |
| OBC (creamy layer) and General (n=28) | 8 (28.6) | 20 (71.4) | |||
| Father’ s employment status (when the graduates joined for BDS) | Entrepreneurs or those engaged in temporary jobs (n=46) | 8 (17.4) | 38 (82.6) | 5.481 | 0.039 |
| Professionals or permanently employed non-professionals employed anywhere (n=7) | 4 (57.1) | 3 (42.9) | |||
| Mother’s employment status (when the graduates joined for BDS) | Homemakers (n=35) | 2 (5.7) | 33 (94.3) | 16.859 | 0.000 |
| Employed (n=18) | 10 (55.6) | 8 (44.4) | |||
| Type of institution | Public (n=6) | 1 (16.7) | 5 (83.3) | 1.441 | 0.487 |
| Private (n=37) | 10 (27.0) | 27 (73.0) | |||
| Cooperative (n=10) | 1 (10.0) | 9 (90.0) | |||
| Employment characteristics of graduates with education loans# (n=38) | Own a clinic (n=8) | 3 (37.5) | 5 (62.5) | 3.082 | 0.214 |
| Full-time practitioners (n=16) | 4 (25.0) | 12 (75.0) | |||
| Part-time practitioners (n=14) | 1 (7.1) | 13 (92.9) | |||
| Current financial situation of graduates with education loans (n=52) | Earn >15,000 rupees/month (n=8) | 2 (25.0) | 6 (75.0) | 0.415 | 0.813 |
| Earn ≤15,000 rupees/month (n=30) | 6 (20.0) | 24 (80.0) | |||
| Currently not earning an income from dentistry* (n=14) | 4 (28.6) | 10 (71.4) |
This suggests that, irrespective of their current financial status or clinic ownership, it appears that their financial background, i.e., parental financial situation is the factor which decides their payment of loans, indicating that incomes of the graduates are not the main sources for loan repayment.
In the last segment of results, we present the profile of the graduates who are unemployed in terms of their gender and caste profile.
Profile of those “Who were Currently not Employed” in Dentistry
We then explored the relationship between selected sociodemographic variables and variables related to the training background with the profile of those who were “currently not employed in dentistry.” A greater proportion of unemployed male graduates reported that were willing to take up any employment opportunity in dentistry (19.4% men as opposed to 14.0% women), while more of unemployed women reported that they were waiting for better jobs than what were being offered to them at the time (29.0% women as opposed to 16.1% men). All the graduates who reported themselves to be homemakers were women.
A greater proportion of SC and OBC non-creamy layer graduates (19.2%) reported that they have been searching for any employment in dentistry when compared to General category and OBC-creamy layer graduates (12.7%). A higher proportion of SC and OBC non-creamy layer also worked without salary (either as residents or interns in public or private health facilities or as postgraduate students in private colleges when compared to General category and OBC creamy layer graduates [23.1% as opposed to 8.9%]). A greater proportion of private and cooperative college trained graduates were unemployed as compared to government college trained graduates (92.36% as opposed to 7.64%).
DISCUSSION
There have been several papers and commentaries in the past two decades which have outlined the potential complications of the drastic growth in dental education in India. Unemployment among dentists was repeatedly raised as a potential and definite consequence of this situation in the literature.[11-13] However, to the best of our knowledge, this is the first study which has empirically examined the professional circumstances of dental professionals in an Indian setting through primary research. The results of the study clearly reveal a situation of a high rate of unemployment and consequently vulnerable financial conditions among the recent dental graduates.
The high rate of unemployment among dentists has been reported internationally from many settings which underwent a sweeping and unregulated growth in dental education, especially after the 1990s. A commonality that the dental education sector from many of these countries - Brazil, Chile, Columbia, and Mexico - shares with India is a predominance of private dental training institutions.[1-5] Another common attribute is the notion of “education and labor wastage” in the literature since the growth in a number of training institutions and graduates has done little to address the issue of poor access to oral health care in these settings. A major reason for this situation is the improper distribution of dentists within the countries, which is affected by urban–rural, public sector–private sector, and other geographic inequities. In the case of the dental profession in India, there are reports that dentists will be in oversupply by over 100,000 by 2030.[14] Despite this, there is a huge mismatch between the urban and rural dentist population ratio with a significant rural deficit and other geographical inequalities in the distribution of dentists.[15] The coexistence of surplus and shortage in the labor market reflects a serious mismatch between demand and supply, and this poses an urgent need to look at the existence of human resource development strategies in the country.
The vulnerable and dependent financial situation of recent dental graduates was another major finding from the study. A survey conducted among undergraduate students, interns, graduates, postgraduates, and lecturers in dental colleges in Bhopal, India, revealed that 44% of the participants were not satisfied with their income. An alarmingly high proportion of dentists who participated in the survey (31%) expressed interest in changing their profession from dentistry.[16]
In our study, we found that the employment opportunities available to the graduates were significantly determined by their social and financial background. When it came to the matter of ownership of clinics, for instance, gender, caste and parents’ educational status of the graduates were the major influencers. A factor which has possibly mediated the association between each of the three variables and ownership of clinics was the ability to raise the finances since starting ones’ practice requires a huge investment. There was a much lower proportion of clinic owners among graduates belonging to OBC (non-creamy layer) and the SC category when compared to the general and OBC (creamy layer) category. Parents’ occupational status was found to be associated with the ownership of clinics. A greater proportion of graduates who were clinic owners belonged to families where the parents were entrepreneurs themselves. Stratified analysis revealed that a greater proportion of graduates from both the general and OBC (creamy layer) categories had mothers who were employed, as compared to the SC and OBC (non-creamy) layer graduates. Thus, mothers’ employment status and financial position of the household could have mediated the caste differences in clinic ownership. The association between mothers’ professional achievement and the professional achievements of the off-springs has been well documented.[17,18] Moreover, families who have earning mothers have the support of two earning members enhancing their financial solvency and ability to avail credit.
Another major determinant of employment and monthly income is the type of training institution with public sector-trained graduates faring better than private sector graduates. Although this difference alone cannot be the basis for concern regarding the quality of training in the private sector and the employability of private sector trained graduates, the creation of two strata of graduates in terms of employment opportunities and financial situation definitely needs to be explored further.
The ownership of clinics significantly enhanced the chances of earning a decent monthly income among graduates (>15,000 INR/month). However, when we tried to explore the association between the financial situation of the graduates and the status of repayment of their educational loans, we found that neither ownership of clinics nor a better monthly income was associated with repayment of loans. It was the socioeconomic status of the family (fathers’ and mothers’ occupational status and the number of earning members) which was significantly associated with repayment of loans, emphasizing the financially dependent status of the graduates.
The proportion of females who were “currently unemployed” was higher than males. A greater proportion of male graduates earned more income and owned clinics than women graduates. When it came to gender differences, in addition to the social and economic position of the families, the prevalent social norms of patriarchy also could have played a crucial role.
The findings of the study also have broader implications for the situation of oral health workforce and dental profession in India. A study conducted in Australia reports that satisfaction with the remuneration is one of the major dimensions contributing to job satisfaction among dentists. Job satisfaction among dental professionals has been reported to be an important factor determining their job retention. The poor remuneration reported among the graduates in this study would have naturally affected their job satisfaction and their attitude toward continuing in the current jobs.[19]
Aspiration for better-remunerated jobs has also been reported as one of the major drivers for emigration among dentists. Emigration is a major global concern with the potential to cause major damage to oral health systems of the source countries. Despite the dramatic upscale in the production of dentists, India still faces a severe shortage of dental professionals in rural and remote areas. This level of underemployment and financial vulnerability among young dentists could lead to greater emigration in search of jobs and better remuneration, further worsening the shortage in oral health workforce in the country.[20]
CONCLUSION
The study findings clearly point to a situation of high unemployment and vulnerable financial situation among the recent dental graduates of Kerala, India. Considering the fact that, dental education is only one among the health professions which underwent a phase of drastic growth in the country subsequent to the economic reforms of the nineties, and these findings have major policy implications for health-professional training and regulation in the country. There is a need for state-led interventions to create more employment opportunities in dentistry, especially in the public sector, as this will not only address the overcrowding in the private dental practice sector but also indirectly enhance the access and quality of oral health care. The high “educational and labor wastage” among dentists emphasizes the need for strengthening the regulatory framework in dental profession. It also points toward the need for a state-wise comprehensive assessment of dental manpower requirements to estimate the number of dentists actually needed. This becomes inevitable considering the indications of oversupply of dentists in the country in near future. This will also help address the issue of geographic and urban–rural inequities in the distribution of dentists.
Financial support and sponsorship
Nil.
Conflicts of interest
There are no conflicts of interest.
REFERENCES
- Failure of policy initiatives in regulating health professional education: The case of dental education in India. J Health Manag. 2018;20:88-91. Available from: https://www.10.1177/0972063418799182
- [Google Scholar]
- Exponential growth of dental schools in Chile: Effects on academic, economic and workforce issues. Braz Oral Res. 2013;27:471-7.
- [Google Scholar]
- Dentist education and labour market in Mexico: Elements of policy definition. 2012. Hum Resour Health. 10:31. Available from: http://www.human-resources-health.com/content/10/1/31
- [Google Scholar]
- Oral health workforce planning Part 2: Figures, determinants and trends in a sample of world dental federation member countries. Int Dent J. 2014;64:117-26.
- [Google Scholar]
- National Health Portal Dental Colleges in Kerala. Available from: http://www.nhp.gov.in/dental-colleges-in-kerala pg
- Preparedness and practice management skills of graduating dental students entering the workforce. Educ Res Int 2015 2015:8. Available from: https://www.dx.doi.org/10.1155/2015/976124
- [Google Scholar]
- Sample size estimation and power calculation a guide to biomedical researchers. Pulmon. 2013;15:25-34.
- [Google Scholar]
- Increasing unemployment among Indian dental graduates high time to control dental manpower. JGOH. 2015;7:1-2.
- [Google Scholar]
- Future of dentistry in India: A raise or fall. J Contemp Orofac Health Res. 2015;1:41-2.
- [Google Scholar]
- The future prospects of dental graduates in India: A review. Int J Contemp Med Surg Radiol. 2018;3:B156-60.
- [Google Scholar]
- Dental manpower planning in India: Current scenario and future projections for the year 2020. Int Dent J. 2014;64:62-7.
- [Google Scholar]
- Choosing dentistry as a career a matter of concern a survey. N Niger J Clin Res. 2017;6:16-20.
- [Google Scholar]
- Working and nonworking mothers with infants: Perceptions of their careers, their infants'needs, and satisfaction with mothering. Dev Psychol. 1978;14:37-43.
- [Google Scholar]
- The international migration of dentists: Directions for research and policy. Community Dent Oral Epidemiol. 2016;44:301-12.
- [Google Scholar]
- Job satisfaction of the oral health labour force in Australia. Aust Dent J. 2011;56:23-32.
- [Google Scholar]