Is suicide a significant contributor to mortality in head and neck cancer - A surveillance, epidemiology, and end results database study
* Corresponding author: Rooban Thavarajah, Department of Oral and Maxillofacial Pathology, Marundeeswara Oral Pathology Services, Chennai – 600 119, Tamil Nadu, India. t.roobanmds@gmail.com
-
Received: ,
Accepted: ,
Abstract
Introduction:
Patients with oral and orofacial cancers have been suggested at increased risk for suicide, but only a few studies have described the survival characteristics. The purpose of this study was to describe survival (5-years), mortality, and suicide among patients with mid-facial head and neck cancer (HNC) and to identify the patient and disease characteristics associated with higher suicide rates.
Methods:
Patients in the study were residents of geographic areas served by the Surveillance, Epidemiology, and End Results (SEER) program who were diagnosed with cancer from 1973 to 2014. This was a retrospective cohort study of survival (classified into 5 groups), mortality with a focus on suicide in persons with HNC. All relevant details were collected and analyzed. P ≤ 0.05 was considered significant.
Results:
There were 218,048 cases of HNC of who 774 committed suicide, 63,262 succumbed to HNC, 44,113 died due to other causes, and 81,779 are alive. Tongue was the most common site and most common type was squamous cell carcinomas. The overall mean 5-year survival period did not remarkably change since 1974. The mean survival period significantly varied between the outcome groups. Mean 5-year survival in cases of suicide was progressively decreasing with time frame while death due to other causes occurred at a relatively less time in 2003–08 as compared to 1973–78. Of interest is the nearly stable survival, by volume in death due to HNC in the entire span of time 1973–2008 but different in percentage level.
Conclusion:
It has been documented that patients with HNC in the SEER database have a higher incidence of suicides influenced by oral sites, stages, and number of tumors. These points to the need for psychological evaluation of patients with HNC and the relationship of tumor stage with survival characteristics. The study also highlights the burden of oral cancer and mental health issues that are largely neglected.
Keywords
Head and neck cancer
5-year survival
Depression
SEER database
Suicide
Tumor grades
Tumor numbers


INTRODUCTION
A diagnosis of cancer is a major stressor event for the patient and family, uncontrolled pain and physical symptoms may lead to suicidal thoughts. The psychological distress, feeling of lack of autonomy, independence/hope, feeling of helplessness, impending morbidity associated with cancer and its treatment, associated economic crisis, familial outlook, decreased quality of life, and depression (psychosocial factors) are factors that play a crucial role in such suicide ideation and completion. Age, gender, treatment type, and stage of cancers (individual factors) may also play a predominant role in determining the suicidal risk. Cumulatively, these factors increase the risk of suicide among People Living With Cancer (PLWC) as compared to the general population.[1] It has been reported that about 17.7% of American PLWC harbor suicidal ideation. Affective illness, alcoholism, and depression are some of the important determinants of suicide even in the physically healthy population.[2,3] Apart from cancer-specific morbidities, psychosocial and psychosomatic effects of cancer, organic mental syndromes, and/or exacerbation of pre-existing psychopathologic abnormalities are also reported to predispose to suicides or suicidal tendencies.[2-4]
There are reports of higher incidence of suicide among mid-facial, head and neck cancers (HNC, including laryngeal and thyroid tumors), as compared to the general population and PLWC.[5-11] Suicide incidence is noted to be very high for larynx and to some extent thyroid cancers and the prevalence influenced by the treatment and staging. The concepts of treatment/staging are constantly evolving with time and repeatedly undergo periodic changes. Irrespective of the evolving concepts of treatment and staging, HNC suicides are reported to be increasing in North America.[5,7] The influence of grade of HNC at diagnosis on survival outcome also has not been studied. Furthermore, there are very few reports addressing suicides in non-laryngeal, non-thyroidal HNC in the recent literature.[5,7] Reports of survival patterns between grades of tumors, number of malignant tumors of non-laryngeal, and non-thyroidal HNC are very few.
There is a recent report of depressive factors influencing survival among patients with HNC.[12] Tongue cancer is emerging as a cause of concern among Indians, and there is no reliable data on the extent of suicides and depression among this subset of patients.[13,14] Lessons from existing large scale data would help Indian oral cancer and mental health-care personnel to address the issue of oral, HNC survival, and suicides effectively. Hence, using a large, publicly available American database, an attempt is made to address the lacunae and describe the survival pattern in non-laryngeal, non-thyroidal HNC with emphasis on suicide.
MATERIALS AND METHODS
Patient Population
This is a secondary data analysis of existing, depersonalized data, available in open web domain (www.seer.cancer.gov); appropriate permission for access was obtained from authorities. The Surveillance, Epidemiology, and End Results (SEER) program was used to identify patients with cancers. The SEER database, covering about 28% of all US citizens has all pertinent patient demographics that allow further analyses of the survival data. For the purpose of this study, all cancers of the head and neck region (nasal cavity, nasal sinuses, nasopharynx, oral cavity, oropharynx, salivary glands, hypopharynx, and abbreviated together as HNC) were collected. The present study did not involve interaction with human participants or the use of any personal identifying information. Hence, Institutional Review Board approval was not required.
Patient Selection Criteria
The patient study population used in this cohort was obtained from the SEER-18 registry, of USA.[15] The time period was from 1973 to 2014. Details of all HNC patients were collected using case listing procedure using SEER*Stat program of SEER (Surveillance Research Program, National Cancer Institute SEER*Stat software (www.seer.cancer.gov/seerstat) version 8.3.4, 2017). Further details about the program remain accessible at https://seer.cancer.gov/resources/.
From this 18 registries all patients with HNC region as described below were included. Sites of cancer were classified as hypopharynx (pyriform sinus, posterior cricoid region, aryepiglottic fold, and hypopharynx), nasopharynx (nasopharynx and walls), oral cavity and oropharynx (external lip, mucosa of lip, commissure of lip, lip, tongue, lingual tonsil, gum, floor of mouth, hard palate, soft palate, palate, uvula, cheek mucosa, vestibule of mouth, retromolar area, tonsillar fossa, vallecula, epiglottis, pharynx, and oropharynx), salivary glands (parotid gland, submandibular gland, and sublingual gland), and nasal cavity and sinuses (accessory sinus, sphenoid sinus, ethmoid sinus, frontal sinus, and maxillary sinus). Larynx and thyroid gland were not included in this study.
Patient Characteristics
Using the case-listing option of SEER*Stat software, all HNC patient data for sex, age, race, marital status, year of diagnosis, primary site of cancer, cause of death, survival time, cancer staging, and status at follow-up were collected. Patients were considered to have committed suicide only if the cause of death on record was entered as “suicide and self-inflicted injury.” Based on their last follow-up status, patient’s survival outcome was broadly classified as alive, dead due to any HNC, dead due to any other cause, death due to cancer (but not sure of primary - N/A not first tumor) and those committed suicide. The survival months as per the SEER database and the number of tumors (malignant/in situ) at the time of initial presentation were also collected.
Based on age (in years), the study population was stratified as 0–14, 15–30, 31–44, 45–60, 61–74, and 75 and above. Race was broadly classified as Caucasians, Afro-Americans, natives (Alaska and native Indians), and others. Marital status at the time of diagnosis was classified as married, never married, divorced, separated, unmarried, widowed, and unknown. Gender was marked as male or female. The grade of tumor at diagnosis was marked as well differentiated (Grade I), moderately differentiated (Grade II), poorly differentiated (Grade III), and undifferentiated or anaplastic (Grade IV) and unknown. Time periods were 1973–1978, 1979–1984, 1985–1990, 1991–1996, 1997–2002, 2003–2008, and 2009–2014. The side of involvement was reported as a bilateral, single primary, left - origin of primary, not a paired site, only one side - side unspecified, paired site, but no information concerning laterality and right - origin of primary. Based on insurance coverage (where data was available), the study population was divided as those with any Medicaid, insured, insured - no specifics, uninsured and insurance status - unknown. For each of the patient, 5-year survival was calculated, classified as survived or succumbed to any of the cause, as described earlier. As for the time period between 2009 and 2014, 5-year survival could not be calculated; they were excluded from 5-year survival analysis.
All data were acquired in November 2017, and statistical analysis was performed using the Statistical Package for the Social Services (Version-23, IBM, IL, USA). Descriptive statistics were presented for all the variables in the 5 types of outcome groups. Chi-square test was used to identify the difference between them. Using appropriate statistical tools, the difference in mean survival months and the number of malignant/in situ tumors were studied. A Kaplan–Meier analysis of survival was carried out to see the survival characteristics in grades of tumors, with death/alive being the event and stratified by the type of outcome. Multiple regression analysis was employed to assess the impact of the demographics parameters studied on the 5-year survival period for the entire study population in the time period 1974–2008. The 2009–2014 was omitted as 5-year survivals for a majority of the patients were not computable. P ≤ 0.05 was taken as significant.
RESULTS
Individual depersonalized data collected from the SEER-18 registry from 1973 to 2014 as of November-2016 and released in April-2017 (inclusive of adjustments due to Hurricane Katrina) and linked to all states and counties were repeatedly run to collect maximum data. The entire study population with HNC, as defined in the material and method section was classified as that is alive, committed suicide, dead (not first tumor), dead due to HNC, and dead due to other conditions.
In all, data of 218,048 USA residents in the SEER database with HNC (having substantial details) were collated. Of these, 774 people committed suicide during 1973–2014, 81779 (37.5%) were alive, 63262 (29%) dead due to HNC, 28120 (12.9%) dead in not first tumor category, and 44113 (20.2%) dead due to other causes. The average survival period was 62.83 ± 73.87 (95% Confidence interval = 62.52–63.14) months, median of 34 months and the range was 0–503 months, with an interquartile range of 79 (11–90) months. Of all HNC cases, tongue was the most common site (25.6%, n = 55878) followed by gum and other mouth (14.7%, n = 32086). Majority of the cases were squamous cell carcinoma (SCC, 83%, n = 181000).
The demographics of age group, gender race, insurance subscription, site of HNC, grade of HNC, year of occurrence, and marital state at the time of diagnosis were compared with the present status of the patients. The distribution of the same is given in Table 1. All the parameters considered were statistically significant differences between the patient survival outcomes (P = 0.000).
| Parameters | Alive | Dead | |||
|---|---|---|---|---|---|
| Suicide | Not first tumor | HNC | Other causes | ||
| Age (years) | |||||
| ≤14 | 515 (0.6) | - | 3 (0.0) | 91 (0.1) | 10 (0.0) |
| 15–29 | 2457 (3) | 7 (0.9) | 39 (0.1) | 497 (0.8) | 127 (0.3) |
| 30–44 | 9843 (12) | 60 (7.8) | 469 (1.7) | 3918 (6.2) | 1432 (3.2) |
| 45–59 | 33,181 (40.6) | 261 (33.7) | 4866 (17.3) | 21,286 (33.6) | 11007 (25) |
| 60–74 | 27,285 (33.4) | 321 (41.5) | 12155 (43.2) | 24,479 (38.7) | 19182 (43.5) |
| >75 | 8498 (10.4) | 125 (16.1) | 10588 (37.3) | 12,991 (20.5) | 12,355 (28) |
| Sex | |||||
| Male | 55,483 (67.8) | 710 (91.7) | 18,486 (65.7) | 44,488 (70.3) | 30713 (69.6) |
| Female | 26,296 (32.2) | 64 (8.3) | 9634 (34.3) | 18,774 (29.7) | 13,400 (30.4) |
| Race | |||||
| Caucasians | 97,909 (83) | 720 (93) | 24,304 (86.04) | 49,800 (78.7) | 38,204 (86.6) |
| Afro-Americans | 5684 (7) | 21 (2.7) | 2649 (9.4) | 8859 (14) | 3647 (8.3) |
| Natives | 466 (0.6) | 2 (0.3) | 115 (0.4) | 371 (0.6) | 173 (0.4) |
| Asian/pacific islanders | 64 38 (7.9) | 26 (3.4) | 1039 (3.7) | 4057 (6.4) | 1901 (4.3) |
| Unknown | 1281 (1.6) | 5 (0.6) | 13 (0) | 175 (0.3) | 188 (0.4) |
| Marital status | |||||
| Married | 47,590 (58.2) | 426 (55) | 14,277 (50.8) | 29,614 (46.8) | 22,973 (52.1) |
| Never married | 13,903 (17) | 111 (14.3) | 3098 (11) | 11,476 (18.1) | 5344 (12.1) |
| Divorced | 7561 (9.2) | 105 (13.6) | 3003 (10.7) | 8163 (12.9) | 4371 (9.9) |
| Separated | 780 (1) | 4 (0.5) | 388 (1.4) | 1310 (2.1) | 741 (1.7) |
| Unmarried | 115 (0.1) | 0 | 7 (5) | 14 (0) | 5 (0) |
| Widowed | 4696 (5.7) | 71 (9.2) | 5431 (19.3) | 9287 (14.7) | 7309 (16.6) |
| Unknown | 7134 (8.7) | 57 (7.4) | 1916 (6.8) | 3398 (5.4) | 3370 (7.6) |
| Tumor grade | |||||
| Well Differentiated | 12,389 (15.1) | 117 (15.1) | 3905 (13.9) | 6339 (10) | 8327 (18.9) |
| Moderately | 26,595 (32.5) | 273 (35.3) | 10,274 (36.5) | 21,226 (33.6) | 13779 (31.2) |
| Poorly | 19,212 (23.5) | 177 (22.9) | 6145 (21.9) | 16,471 (26) | 8032 (18.2) |
| Undifferentiated | 3013 (3.7) | 22 ((2.8) | 732 (2.6) | 2426 (3.8) | 1175 (2.7) |
| Unknown | 20,570 (25.2) | 185 (23.9) | 7064 (25.1) | 16,800 (26.6) | 8327 (18.9) |
| Site | |||||
| Floor of mouth | 3452 (4.3) | 68 (8.8) | 2376 (8.4) | 5124 (8.1) | 4381 (9.9) |
| Gum and other mouth | 10,116 (12.4) | 90 (11.6) | 5448 (19.4) | 9473 (15) | 6959 (15.8) |
| Hypopharynx | 2386 (2.9) | 76 (9.8) | 2876 (10.2) | 7235 (11.4) | 3013 (6.8) |
| Lip | 7527 (9.2) | 84 (10.9) | 1980 (7) | 1280 (2) | 8337 (18.9) |
| Nasopharynx | 5170 (6.3) | 52 (6.7) | 925 (3.3) | 4977 (7.9) | 1863 (4.2) |
| Oropharynx | 1981 (2.4) | 31 (4) | 1075 (3.8) | 2898 (4.6) | 1165 (2.6) |
| Other oral cavity and pharynx | 1078 (1.3) | 24 (3.1) | 1035 (3.7) | 2493 (3.9) | 969 (2.2) |
| Salivary gland | 11,273 (13.8) | 65 (8.4) | 2554 (9.1) | 5153 (8.1) | 4040 (9.2) |
| Tongue | 23,232 (28.4) | 191 (24.7) | 7075 (25.2) | 16,584 (26.1) | 8846 (20.1) |
| Tonsil | 15,474 (18.9) | 93 (12) | 2776 (9.9) | 8095 (12.8) | 4540 (10.3) |
| Laterality | |||||
| Bilateral, single primary | 119 (0.1) | - | 38 (0.1) | 108 (0.2) | 35 (0.1) |
| Left - origin of primary | 16,496 (20.2) | 87 (11.2) | 3336 (11.9) | 7663 (12.1) | 4789 (10.9) |
| Not a paired site | 47,727 (58.4) | 587 (75.8) | 21,312 (75.8) | 47,130 (74.5) | 34,129 (77.4) |
| Only one side - side unspecified | 60 (0.1) | 0 | 18 (0.1) | 89 (0.1) | 48 (0.1) |
| Paired site, but no information concerning laterality | 254 (0.3) | 0 | 114 (0.4) | 504 (0.8) | 171 (0.4) |
| Right - origin of primary | 17,123 (20.9) | 100 (12.9) | 3302(11.7) | 7768 (12.3) | 4941 (11.2) |
| Extent | |||||
| Distant | 5597 (8.6) | 69 (9.1) | 3320 (12) | 12,843 (20.9) | 3252 (7.4) |
| Localized | 32,735 (41.9) | 290 (38.2) | 10,309 (37.2) | 9980 (16.2) | 18,924 (43.3) |
| Regional | 35,295 (45.1) | 351 (46.2) | 11,577 (41.8) | 33,215 (54) | 18,017 (41.2) |
| Unstaged | 3482 (4.5) | 50 (6.6) | 2483 (9) | 5507 (8.9) | 3485 (8) |
| Time phase (diagnosis) | |||||
| 1973–78 | 536 (0.7) | 79 (10.2) | 1295 (4.6) | 5371 (8.5) | 6012 (13.6) |
| 1979–84 | 838 (1) | 87 (11.2) | 2079 (7.4) | 6114 (9.7) | 6469 (14.7) |
| 1985–90 | 1505 (1.8) | 102 (13.2) | 2374 (8.4) | 5919 (9.4) | 5852 (13.3) |
| 1991–96 | 3430 (4.2) | 80 (10.3) | 3496 (12.4) | 7659 (12.1) | 6575 (14.9) |
| 1997–02 | 9940 (12.2) | 134 (17.3) | 5710 (20.3) | 12038 (19) | 8008 (18.2) |
| 2003–08 | 22341 (27.3) | 179 (23.1) | 7494 (26.7) | 15279 (24.2) | 7748 (17.6) |
| 2009–14 | 43189 (52.8) | 113 (14.6) | 5672 (20.2) | 10882 (17.2) | 3449 (7.8) |
All factors had a Chi-square test P= 0.001. HNC: Head and Neck Cancer
An attempt was made to compare the survival period in terms of the patient outcome. After excluding the 2009–14 periods for reasons mentioned earlier, it was observed that 154,743 HNC patients formed the study group, out of which survival details of 830 patients were not available. Of the remaining 153,913 HNC patients, 79,514 died within 5 years. It included 416 (0.5%) suicides, 17,092 (21.5%) death (not first tumor), 43,299 (54.5%) death due to HNC, and 18,707 (23.5%) death due to other causes. The difference in other predictors is shown in Table 2.
| Parameters | Vital status | ||
|---|---|---|---|
| Status at 5 year | |||
| Alive | Currently Dead | ||
| Alive | Alive | Dead | |
| Count (%) | Count (%) | Count (%) | |
| Sex | |||
| Female | 26,296 (38.82) | 12086 (17.84) | 29,351 (43.33) |
| Male | 55,483 (37.2) | 24,368 (16.34) | 69,300 (46.46) |
| Site | |||
| Floor of mouth | 3542 (22.89) | 3821 (24.69) | 8110 (52.41) |
| Gum and other mouth | 10,116 (31.74) | 6054 (18.99) | 15704 (49.27) |
| Hypopharynx | 2386 (15.34) | 2071 (13.32) | 11094 (71.34) |
| Lip | 7527 (39.26) | 6755 (35.23) | 4890 (25.51) |
| Nasopharynx | 5170 (40.03) | 1918 (14.85) | 5827 (45.12) |
| Oropharynx | 1981 (28.02) | 737 (10.43) | 4351 (61.55) |
| Other oral cavity and pharynx | 1078 (20.56) | 621 (11.84) | 3544 (67.59) |
| Salivary gland | 11,273 (49.08) | 3483 (15.17) | 8211 (35.75) |
| Tongue | 23,232 (41.72) | 7301 (13.11) | 25,158 (45.17) |
| Tonsil | 15,474 (50.03) | 3693 (11.94) | 11,762 (38.03) |
| Age group | |||
| <14 years | 515 (83.2) | 16 (2.58) | 88 (14.22) |
| 15–29 years | 2457 (78.7) | 201 (6.44) | 464 (14.86) |
| 30–44 years | 9843 (62.67) | 1892 (12.05) | 3971 (25.28) |
| 45–59 years | 33,181 (47.12) | 10970 (15.58) | 26,270 (37.3) |
| 60–74 years | 27,285 (32.84) | 16342 (19.67) | 39454 (47.49) |
| 75 years | 8498 (19.34) | 7033 (16.01) | 28404 (64.65) |
| Marital status | |||
| Divorced | 7561 (32.87) | 3344 (14.54) | 12098 (52.59) |
| Married (including common law) | 47,590 (41.55) | 21,441 (18.72) | 45,509 (39.73) |
| Separated | 780 (24.53) | 528 (16.6) | 1872 (58.87) |
| Single (never married) | 13,903 (41.16) | 3848 (11.39) | 16031 (47.45) |
| Unknown | 7134 (45.09) | 2540 (16.05) | 6149 (38.86) |
| Unmarried or domestic partner | 115 (81.56) | 0 (0) | 26 (18.44) |
| Widowed | 4696 (17.78) | 4753 (17.99) | 16966 (64.23) |
| Race | |||
| American indian/Alaska native | 466 (41.57) | 139 (12.4) | 516 (46.03) |
| Asian or pacific islander | 6438 (48.020 | 1865 (13.91) | 5104 (38.07) |
| Afro-American | 5684 (27.43) | 2594 (12.52) | 12446 (60.06) |
| Unknown | 1282 (77.89) | 112 (6.8) | 252 (15.31) |
| Caucasians | 67,909 (37.73) | 31,744 (17.64) | 80,333 (44.63) |
| Grade | |||
| Well differentiated; Grade I | 12,389 (39.88) | 7352 (23.67) | 11325 (36.45) |
| Moderately differentiated; Grade II | 26,595 (36.87) | 11218 (15.55) | 34,324 (47.58) |
| Poorly differentiated; Grade III | 19,212 (38.41) | 6210 (12.41) | 24,601 (49.18) |
| Undifferentiated; anaplastic; Grade IV | 3013 (40.9) | 1011 (13.72) | 3343 (45.38) |
| Unknown | 20570 (36.54) | 10663 (18.94) | 25058 (44.52) |
| Laterality | |||
| Bilateral, single primary | 119 (39.67) | 24 (8) | 157 (52.33) |
| Left - origin of primary | 16,496 (50.98) | 3945 (12.19) | 11917 (36.83) |
| Not a paired site | 47,727 (31.82) | 28,371 (18.92) | 73,881 (49.26) |
| Only one side - side unspecified | 60 (28.71) | 40 (19.14) | 109 (52.15) |
| Paired site, but no information concerning laterality | 254 (31.24) | 95 (11.69) | 464 (57.07) |
| Right - origin of primary | 17,123 (51.54) | 3979 (11.98) | 12,123 (36.49) |
| Spread- SEER | |||
| Distant | 6697 (25.6) | 1794 (6.86) | 17,671 (67.54) |
| Localized | 32,735 (45.33) | 17,542 (24.29) | 21,942 (30.38) |
| Regional | 35,295 (35.86) | 14304 (14.53) | 48836 (49.61) |
| Unstaged | 3482 (24.97) | 2545 (18.25) | 7915 (56.77) |
| Outcome | |||
| Alive | 81,779 (100) | 0 (0) | 0 (0) |
| Suicide | 0 (0) | 248 (32.33) | 519 (67.67) |
| Dead not first tumor | 0 (0) | 5445 (19.43) | 22580 (80.57) |
| Dead due to HNC | 0 (0) | 8679 (13.91) | 53720 (80.09) |
| Dead due to other cause | 0 (0) | 22082 (50.28) | 21832 (49.72) |
| Time phase | |||
| 1973–78 | 536 (4.06) | 5228 (39.56) | 7452 (56.39) |
| 1979–84 | 838 (5.4) | 5850 (37.69) | 8832 (56.91) |
| 1985–90 | 1505 (9.6) | 5520 (35.23) | 8645 (55.17) |
| 1991–96 | 3430 (16.2) 3 | 6398 (30.28) | 11301 (53.49) |
| 1997–02 | 9940 (27.89) | 7622 (21.39) | 18079 (50.73) |
| 2003–08 | 22,341 (42.36) | 5676 (10.76) | 24720 (46.87) |
| 2009–14 | 43,189 (68.59) | 160 (0.25) | 19622 (31.16) |
| Insurance | |||
| Any medicaid | 5368 (51.08) | 215 (2.05) | 4927 (46.88) |
| Insurance status unknown | 2860 (61.47) | 99 (2.13) | 1694 (36.41) |
| Insured | 34,579 (68.59) | 1195 (2.37) | 14643 (29.04) |
| Insured/No specifics | 7584 (58.99) | 324 (2.52) | 4948 (38.49) |
| Uninsured | 1890 (57.71) | 45 (1.37) | 1340 (40.92) |
The mean survival period in the 5-year (60 months, 1974–2008) period did not change over the time phases since 1974. [Figure 1] Mean 5-year survival in cases of suicide, was progressively decreasing with time frame while death due to other causes occurred at a relatively less time in 2003–08 as compared to 1973–78. Of interest is the nearly stable survival, by volume in death due to HNC in the entire span of time 1973–2008 but presented with a difference when expressed as a percentage in 5-year survival [Figure 2].
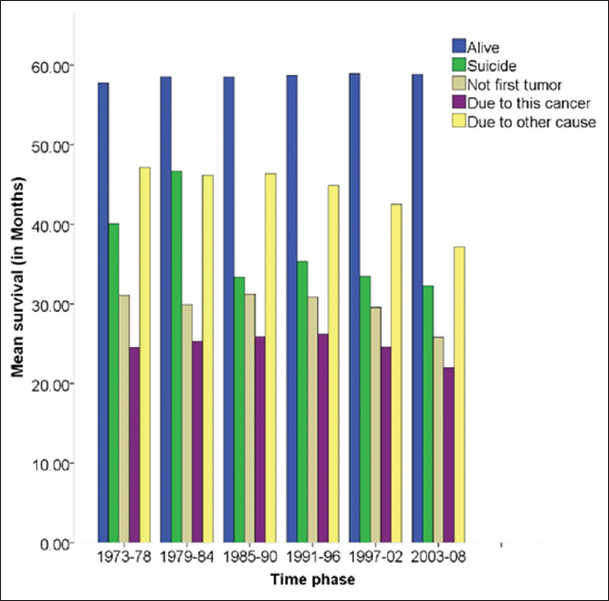
- Mean 5-year survival in head and neck cancer patients in different time phases.

- Number of head and neck cancer and 5-year survival in different time phases.
Kruskal–Wallis test revealed that pooled (overall) and 5-year survival period differed between the 5-outcome groups. The survival period varied significantly between the 5-groups (P = 0.000). Death due to HNC occurred at a relatively lower mean months in pooled and 5-year survival analysis. This was closely followed by death in not first tumor group trailed by suicide and death due to other causes. The difference was statistically significant (P = 0.000). ANOVA test showed that death due to “not first oral tumor” had highest mean number of tumors (2.55 ± 0.93) followed by patients who committed suicide had a mean (1.45 ± 0.79) of malignant tumors while those who were alive had 1.31 ± 0.67 tumors, dead due to HNC had 1.31 ± 0.67, and those dead due to other causes 1.39 ± 0.63. The difference was statistically significant (P = 0.000) [Table 3].
| Parameters | Outcome | Mean±SDa* Kruskal-Wallis test; ^One-way ANOVA (in months) | 95% CI for mean | Min | Max | P-Value | |
|---|---|---|---|---|---|---|---|
| Lower | Upper | ||||||
| Overall survival period (1973–2014)* | Alive | 146.73±79.81 | 145.93 | 147.53 | 0 | 503 | 0.000 |
| Suicide | 62.70±69.55 | 57.36 | 68.04 | 0 | 397 | ||
| Dead- Not first tumor | 41.81±50.43 | 41.15 | 42.47 | 0 | 478 | ||
| Dead- due to HNC | 34.11±48.42 | 33.69 | 34.52 | 0 | 476 | ||
| Dead - due to other cause | 90.26±83.93 | 89.44 | 91.08 | 0 | 496 | ||
| 5-year survival period (1973–2008)* | Alive | 58.83±7.47 | 58.75 | 58.90 | 0 | 60 | 0.0000 |
| Suicide | 35.89±23.28 | 34.11 | 37.66 | 0 | 60 | ||
| Dead- Not first tumor | 28.82±22.34 | 28.52 | 29.11 | 0 | 60 | ||
| Dead- due to HNC | 24.30±20.89 | 24.13 | 24.48 | 0 | 60 | ||
| Dead - due to other cause | 43.71±21.47 | 43.50 | 43.92 | 0 | 60 | ||
| Number of tumors^ | Alive | 1.31±0.67 | 1.30 | 1.31 | 1 | 12 | 0.0000 |
| Suicide | 1.45±0.79 | 1.39 | 1.51 | 1 | 11 | ||
| Dead- not first tumor | 2.55±0.93 | 2.54 | 2.56 | 2 | 13 | ||
| Dead- due to HNC | 1.15±0.46 | 1.15 | 1.16 | 1 | 11 | ||
| Dead - due to other cause | 1.39±0.63 | 1.38 | 1.39 | 1 | 8 | ||
Kaplan–Meier survival statistics were performed to estimate the 5-year (60 months) survival characteristics of the study population in the time frame of 1973–2008. The endpoint was demise due to any cause which was stratified based on survival outcome, as described earlier. A log-rank test was run to determine if there were differences in the survival distribution for the different outcomes in death (suicide, death due to HNC, death due to other causes, and not primary tumor) as strata and grade of tumors as a factor. The survival distribution was statistically significant difference, χ2(2) = 99.192, P < 0.0005. [Figure 3]. The characteristics are given in Table 4. In the case of suicides, it was observed that about 550% of cases succumbed before the 30 months. Anaplastic group (Group IV) had a rapid drop in the slope in the graph as compared to other grades of HNC. In death due to HNC and not a first tumor, there was no remarkable difference between the grades of the tumor while the slope of the graph was uniform for all tumor grades in the group of patients that succumbed due to other causes.

- Kaplan–Meier curve for 5-year survival outcome of head and neck cancer as compared by the grades of tumor in the study group. (a) Death due to head and neck cancer (b) Death due to - not first tumor (c) death due to other causes (d) death due to suicides.
| Outcome | Mean | Median | ||||||
|---|---|---|---|---|---|---|---|---|
| Estimate | Std. Error | 95% Confidence interval | Estimate | Std. Error | 95% Confidence interval | |||
| Lower | Upper | Lower | Upper | |||||
| Alive | ||||||||
| Grade I | 59.448 | 0.045 | 59.360 | 59.535 | 60.000 | 0.000 | ||
| Grade II | 59.423 | 0.034 | 59.356 | 59.491 | 60.000 | 0.000 | ||
| Grade III | 59.420 | 0.044 | 59.334 | 59.506 | 60.000 | 0.000 | ||
| Grade IV | 59.298 | 0.106 | 59.090 | 59.505 | 60.000 | 0.000 | ||
| Unknown | 59.329 | 0.040 | 59.251 | 59.406 | 60.000 | 0.000 | ||
| Suicide | ||||||||
| Grade I | 25.448 | 2.159 | 21.216 | 29.680 | 25.000 | 5.074 | 15.055 | 34.945 |
| Grade II | 19.468 | 1.311 | 16.898 | 22.037 | 14.000 | 1.550 | 10.962 | 17.038 |
| Grade III | 19.724 | 1.742 | 16.309 | 23.140 | 15.000 | 2.695 | 9.718 | 20.282 |
| Grade IV | 24.667 | 5.472 | 13.941 | 35.392 | 23.000 | 13.856 | 0.000 | 50.159 |
| Unknown | 20.440 | 1.922 | 16.673 | 24.208 | 15.000 | 2.746 | 9.617 | 20.383 |
| Not first tumor | ||||||||
| Grade I | 21.373 | 0.357 | 20.674 | 22.072 | 16.000 | 0.511 | 14.998 | 17.002 |
| Grade II | 18.904 | 0.195 | 18.521 | 19.287 | 14.000 | 0.233 | 13.543 | 14.457 |
| Grade III | 17.192 | 0.237 | 16.726 | 17.657 | 13.000 | 0.268 | 12.475 | 13.525 |
| Grade IV | 17.395 | 0.679 | 16.065 | 18.725 | 13.000 | 0.880 | 11.275 | 14.725 |
| Unknown | 18.983 | 0.253 | 18.488 | 19.478 | 14.000 | 0.347 | 13.319 | 14.681 |
| Due to this cancer | ||||||||
| Grade I | 17.073 | 0.217 | 16.648 | 17.498 | 13.000 | 0.216 | 12.576 | 13.424 |
| Grade II | 16.550 | 0.112 | 16.330 | 16.771 | 13.000 | 0.120 | 12.765 | 13.235 |
| Grade III | 16.749 | 0.129 | 16.496 | 17.002 | 13.000 | 0.141 | 12.723 | 13.277 |
| Grade IV | 18.881 | 0.362 | 18.173 | 19.590 | 15.000 | 0.491 | 14.037 | 15.963 |
| Unknown | 16.195 | 0.141 | 15.918 | 16.472 | 12.000 | 0.145 | 11.717 | 12.283 |
| Due to other cause | ||||||||
| Grade I | 26.638 | 0.319 | 26.013 | 27.263 | 25.000 | 0.576 | 23.870 | 26.130 |
| Grade II | 24.297 | 0.225 | 23.855 | 24.738 | 21.000 | 0.392 | 20.231 | 21.769 |
| Grade III | 22.944 | 0.285 | 22.385 | 23.503 | 19.000 | 0.468 | 18.083 | 19.917 |
| Grade IV | 22.859 | 0.726 | 21.437 | 24.281 | 20.000 | 1.014 | 18.013 | 21.987 |
| Unknown | 23.602 | 0.255 | 23.103 | 24.102 | 21.000 | 0.468 | 20.083 | 21.917 |
Multiple regression analysis was done to predict 5-year survival (in months) of all HNC in 1973–2008, both years inclusive from race, side laterality, tumor grade, marital status at diagnosis, age group, gender, and site among all HNC patient. There was linearity as assessed by partial regression plots and a plot of studentized residuals against the predicted values. Independence of residuals was seen with Durbin Watson statistics (0.1590). There was homoscedasticity, as assessed by visual inspection of a plot of studentized residuals versus unstandardized predicted values. There was no evidence of multicollinearity, as assessed by tolerance values >0.1. There were no studentized deleted residuals ≥±3 standard deviations, no leverage values ≥0.2, and values for Cook’s distance >1. The assumption of normality was met (Q-Q Plot). The multiple regression model statistically significant predicted survival, F (11, 18424) = 203.818, P < 0.0005, adjusted R2 = 0.12. All variables added statistically significant to the reduction, P ≤ 0.05. Regression coefficients and standard errors can be found in Table 5.
| Parameters | Unstandardized coefficients | Standardized coefficients beta | 95% CI for B | Sig. | ||
|---|---|---|---|---|---|---|
| B | Standard error | Lower | Upper | |||
| Constant | 106.187 | 3.513 | 99.302 | 113.072 | 0.000 | |
| Sex | −2.712 | 0.356 | −0.055 | −3.410 | −2.014 | 0.000 |
| State | −0.046 | 0.043 | −0.007 | −0.131 | 0.039 | 0.287 |
| Site | 0.309 | 0.051 | 0.044 | 0.209 | 0.410 | 0.000 |
| Grade | 0.909 | 0.107 | 0.060 | 0.700 | 1.118 | 0.000 |
| Laterality | 0.490 | 0.135 | 0.026 | 0.224 | 0.755 | 0.000 |
| Staging−SEER | 1.060 | 0.205 | 0.036 | 0.657 | 1.462 | 0.000 |
| Race | 1.789 | 0.185 | 0.068 | 1.426 | 2.152 | 0.000 |
| Marital status | −1.396 | 0.094 | −0.109 | −1.580 | −1.212 | 0.000 |
| Age group | −5.705 | 0.177 | −0.232 | −6.053 | −5.357 | 0.000 |
| Time phase | −8.489 | 0.542 | −0.110 | −9.551 | −7.427 | 0.000 |
| Insurance subscription | 1.766 | 0.173 | 0.071 | 1.426 | 2.106 | 0.000 |
DISCUSSION
The purpose of this study was to describe the suicidal and survival characteristics of HNC patients. Previously, such an attempt was made using data till 2011.[5] Knowledge and insight would help policy framers to formulate guidelines for maxillofacial oncology team to sensitize, educate, and identify the PLWC who might have suicidal ideation. Suicide among Indian PLWC is poorly documented, and there has been a report of increasing trends of tongue cancer, especially in non-habit, elderly women.[13,14] Hence, knowledge from this would help Indians to frame better suicide screening among PLWC.
An attempt was made to decipher the influence of grade of HNC at diagnosis on survival outcome of non-laryngeal, non-thyroidal HNC. An attempt was also made to correlate the grades of tumors, number of malignant tumors of non-laryngeal, and non-thyroidal HNC with survival outcomes as defined earlier.
Relatively more percentage of Caucasians (93% of all suicides) committed suicide as compared to 78.7% due to HNC, 7% of Afro-Americans committed suicide, and 14% succumbed to HNC. Males (91.7%) were more likely to commit suicide. This is consistent with other studies and trends too.[5,7] Proportionally, more suicide was associated with moderately differentiated HNC (31.2–36.5%). About 80% of the study population lay in between 45 and 84 years of age. It was observed that a significant number of suicides in HNC occurs in the initial 6 months of diagnosis. Nearly 55% of all HNC suicides occurred within the first 3 years of diagnosis. Tongue and tonsil are the most common sites involved in HNC suicide while the site is often an unpaired HNCs (75.9%). SCC is the most predominant HNC type. All the findings are consistent with earlier reported literature from several parts of the world.[2,5,10]
Suicides represents a small proportion of HNC patient deaths in this sample (0.4%). It has been reported up to 17.7% of all patients with cancer have suicidal ideation. The 0.4% suicide is only a reflection of completion of suicide and is not a measure of suicide ideation or attempts. Persistence of risk of suicide, even after 60 months of initial diagnosis highlights the need for continuous monitoring in this vulnerable population.[2-4] As seen in Figure 1, the mean 5-year survival outcome has not changed during the time phase studied. The “death due to other causes” was progressively decreasing while other outcomes were nearly stable. The number of HNC being diagnosed is increasing over the time phases. As observed in Figure 2, the number of PLWC being alive at 5-year period was increasing while the “death due to other causes” was significantly decreasing while death due to cancer is nearly stable. The advances in medical care for non-cancer related ailments could be the suggested reason, and further factors behind this phenomenon need to be explored.
The survival period, especially the Inter Quartile Range denotes that at least 25% of the suicide category had lived only 11 months after diagnosis while 75% of them live up to 7.5 years after the diagnosis. Similarly, 75% of those who are alive live up to 10 years. 75% of the people who are dead due to HNC live only up to 2 years 9 months since diagnosis. Survival is also influenced by the grade of tumor at presentation [Table 3, Figures 1-4]. The survival trend difference between the grades of the tumor (P = 0.000) and warrants further investigation.
The number of tumors at initial presentation is also significant. As observed in the Table 2, the number of tumors indicates that those HNC who had committed suicide had relatively higher mean number of tumors. To the best of our knowledge, there is pertinent literature to support or refute this claim. The relationship between 5-year survival and grade of tumor (at presentation), as seen in Figure 3, indicates that the grade of the tumor has a definite role to play in 5-year survival, especially with suicides.
Observations of increased prevalence of depression in several types of cancers including HNCs, in higher frequency than general populations, have been reported.[16,17] Depression is a known to be associated with high risk of suicide, even in normal population. Role of neurotransmitter, particularly of serotonin and noradrenaline in depression and suicide have been documented.[18-20] Conventional history and mental health assessment interviews are the current methods to prevent the suicide in HNCs.[21,22] Often the HNCs team, especially from the first contact, surgeons, often feel not sufficiently trained to screen for suicidal tendency and by reflex, they often refer it to the mental health team. Non-compliance to such referrals is not uncommon and may compound to the magnification of the issue.[23]
The statistical outcome of the multiple regression analysis points out several factors, the adjusted R2 being 0.12 (for all HNCs) and indicates that sum of all considered independent variables into this regression model (race, side laterality, tumor grade, marital status at diagnosis, insurance status, age group, gender, and site) explained only up to 12% of the variability of the considered dependent variables. Therefore, many other factors such as morbidity associated with treatment/HNC, concomitant substance abuse, treatment approach, and pre-existing mental illness besides numerous other factors may contribute to the occurrence of suicides in patients with HNCs.
The study also suffers from certain limitations inherent to observational data of SEER. Missing data, reproducibility, reproducibility of data collected from database, representative sampling, etc., pose methodological issues.[24,25] Data collected is based on queries posed in the software, and even alteration of one criterion could change the number of cases in the net result. The relying on the cause of death classification and chance of misclassification of death, including inability to differentiate between treatment-related mortality and death from underlying comorbid conditions or missing out of secondary tumors. In addition, important covariates such as comorbidity, pre-existing mental illness, and substance abuse including but not limiting to tobacco and alcohol, HPV, education, and socioeconomic factors were not factored in this study. Limitation of not including TNM staging parameters, treatment factors, and duration of therapy could have a direct bearing on the results. In the present study, the results of Kaplan–Meier statistics and multiple regression analysis have to be interpreted with caution.[26]
Clinical Implication: Globally studies indicate that non-communicable diseases (NCDs) such as mental illness, substance abuse, and cancer are one of the major causes of mortality and morbidity. Oral diseases have emerged as the single most common NCD, which needs to be addressed.[27-29] Impact of mental illness, substance abuse with respect to oral diseases, including HNC has not been adequately studied. This is in spite of the fact that oral diseases, is a part of NCD and has a major impact on quality of life. The results of this study indicate that there should be a multi-disciplinary approach to provide much-needed relief to, especially, when the patients with oral diseases harbor suicidal ideation.
Key points to be taken
Mental health and oral health remains largely out of the universal medical coverage. This manuscript highlights the one of the commonly neglected medical arenas that needs focused work in future to improve the quality of life. With increasing non-communicable diseases, vulnerability to oral and mental diseases is bound to increase. This manuscript adds strength to the call for integrating mental and oral health issues to mainstream health agenda.
CONCLUSION
The number of HNC tumors has an influence on 5-year survival rate. The 5-year survival characteristics of HNC in patients in the SEER database for the period 1974–2008 is presented. It is observed that suicide risk in PLWC HNC is higher and the grade has a bearing on the 5-year survival. The risk of suicide is high in the initial period of diagnosis and persists even after 10–30 years of diagnosis. Hence, PLWC should be screened by competent mental health professionals, when some signs of negative approach or feelings are expressed by patients. With newer classifications of HNC being proposed based on treatment, importance to mental well-being also should be considered. With increasing survivorship after HNC cancer, there is a need for more structured and evidence-based mental health care that has been already called for.
Acknowledgment
SEER Database Administration is acknowledged for their permission to access the data.
Financial support and sponsorship
Nil.
Conflicts of interest
There are no conflicts of interest.
REFERENCES
- Increasing suicide risk among cancer patients in Lithuania from 1993 to 2012: A cancer registry-based study. Eur J Cancer Prev. 2017;26:S197-S203. Joining forces for better cancer registration in Europe
- [Google Scholar]
- Suicide in cancer patients in California 1997-2006. Arch Suicide Res. 2012;16:324-33.
- [Google Scholar]
- Correlates of suicide ideation in a population-based sample of cancer patients. J Psychosoc Oncol. 2008;26:49-62.
- [Google Scholar]
- Suicide and cancer: Where do we go from here? Crit Rev Oncol Hematol. 2011;78:206-19.
- [Google Scholar]
- Incidence of suicide in patients with head and neck cancer. JAMA Otolaryngol Head Neck Surg. 2015;141:1075-81.
- [Google Scholar]
- Suicide rates in cancer patients in the current Era in United States. Am J Psychiatry Resid. 2017;12:11-4.
- [Google Scholar]
- Competing causes of death in the head and neck cancer population. Oral Oncol. 2017;65:8-15.
- [Google Scholar]
- Suicide: A Major threat to head and neck cancer survivorship. J Clin Oncol. 2016;34:1151.
- [Google Scholar]
- Survivorship and quality of life in head and neck cancer. J Clin Oncol. 2015;33:3322-7.
- [Google Scholar]
- Depressive symptoms predict head and neck cancer survival: Examining plausible behavioral and biological pathways. Cancer. 2018;124:1053-60.
- [Google Scholar]
- Oral squamous cell carcinoma in patients with and without predisposing habits in glossal and extra-glossal site: An institutional experience in South India. Indian J Cancer. 2015;52:625-7.
- [Google Scholar]
- A study on suicide among Indians living with cancer during 2001-2014. Indian J Cancer. 2016;53:435-40.
- [Google Scholar]
- Surveillance, Epidemiology, and End Results (SEER) Program (www.seer.cancer.gov) SEER Stat Database: Incidence SEER 18 Regs Research Data Hurricane Katrina Impacted Louisiana Cases, Nov 2016 Sub (1973-2014 varying) Linked To County Attributes Total U.S., 1969-2015 Counties, National Cancer Institute, DCCPS, Surveillance Research Program, released April 2017, based on the November 2016 submission Availble from: https://seer.cancer.gov/data/citation.html
- Depression and suicide in patients with cancer. J Pain Symptom Manage. 1994;9:325-40.
- [Google Scholar]
- The role of dopamine and serotonin in suicidal behaviour and aggression. Prog Brain Res. 2008;172:307-15.
- [Google Scholar]
- Biomarkers of suicide attempt behavior: Towards a biological model of risk. Curr Psychiatry Rep. 2017;19:31.
- [Google Scholar]
- Routine screening for suicidal intention in patients with cancer. Psychooncology. 2013;22:2537-45.
- [Google Scholar]
- The management of non-compliance with referral to out-patient after-care among attempted suicide patients: A controlled intervention study. Psychol Med. 1995;25:963-70.
- [Google Scholar]
- Registries that show efficacy: Good, but not good enough. J Clin Oncol. 2008;26:5316-9.
- [Google Scholar]
- Apractical guide to understanding Kaplan-Meier curves. Otolaryngol Head Neck Surg. 2010;143:331-6.
- [Google Scholar]
- Global, regional, and national age-sex-specific mortality and life expectancy 1950-2017: A systematic analysis for the global burden of disease study 2017. Lancet. 2018;392:1684-735.
- [Google Scholar]
- Global, regional, and national incidence, prevalence, and years lived with disability for 354 diseases and injuries for 195 countries and territories 1990-2017: A systematic analysis for the global burden of disease study 2017. Lancet. 2018;392:1789-858.
- [Google Scholar]
- Global, regional, and national age-sex-specific mortality for 282 causes of death in 195 countries and territories 1980-2017: A systematic analysis for the global burden of disease study 2017. Lancet. 2018;392:1736-88.
- [Google Scholar]